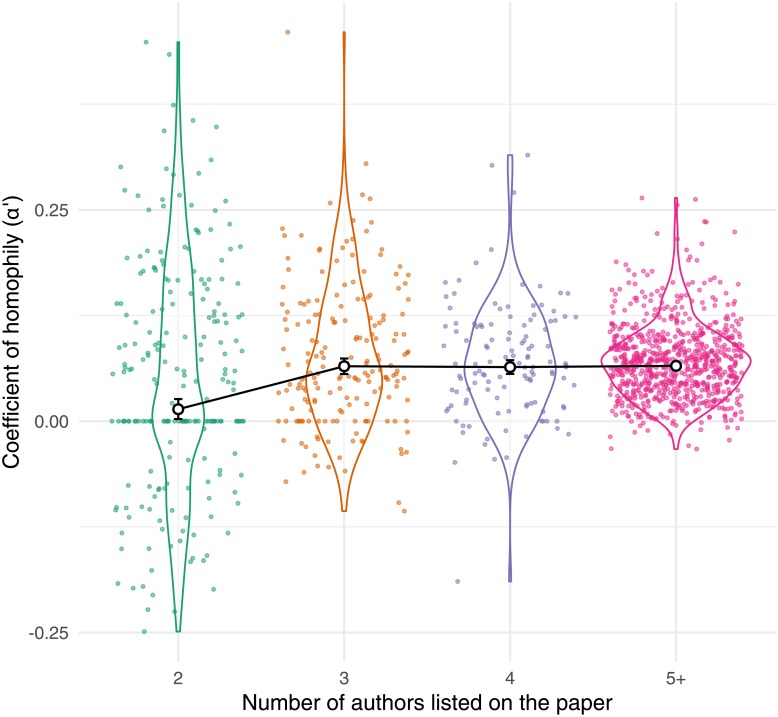
Fig 3. The coefficient of homophily (α′) was slightly less positive when calculated for two-author papers only, relative to papers with longer author lists.
The individual points, whose distribution is summarised by the violin plots, correspond to individual journals. The larger white points show the mean for each group (and its 95% CIs), as calculated by a Bayesian meta-regression model accounting for repeated measures of α′ within journals, as well as the precision with which α′ was estimated.

