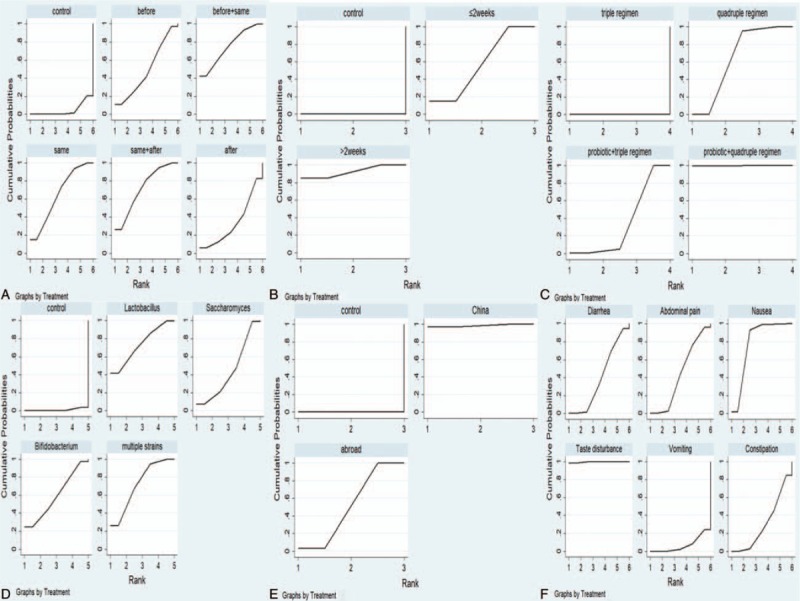
Figure 6.

SUCRA plot of subgroup and common side effects. (A) Probiotic addition time; (B) duration of probiotic addition; (C) eradication regimens; (D) species of probiotics; (E) location; (F) common side effects. SUCRA = surface under the cumulative ranking curve.
