
Figure 2.
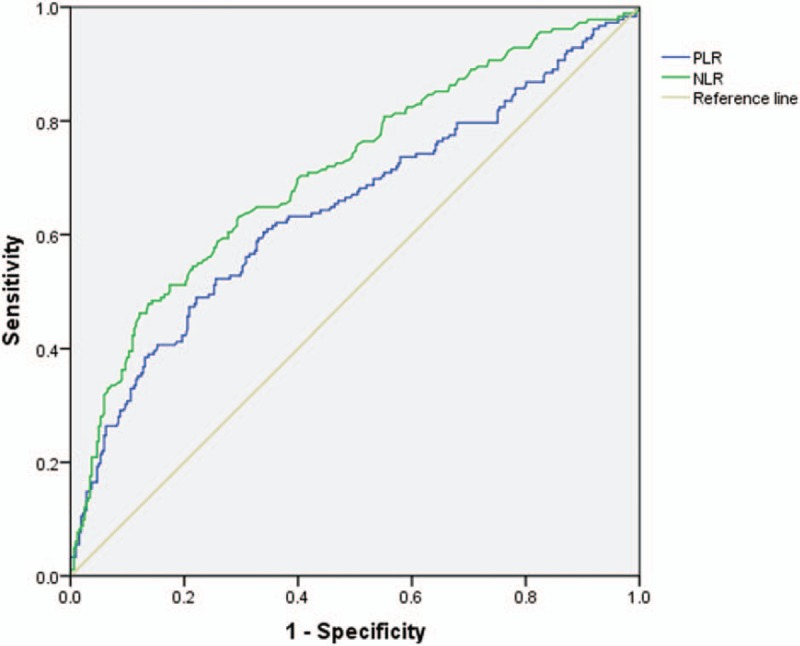
The ROC analysis of NLR and PLR between primary and nonprimary spine tumor groups. The AUC for NLR was 0.713, for PLR was 0.647. AUC = area under the receiver operating characteristic curve, NLR = neutrophil-to-lymphocyte ratio, PLR = platelet-to-lymphocyte ratio, ROC = receiver operating characteristic.