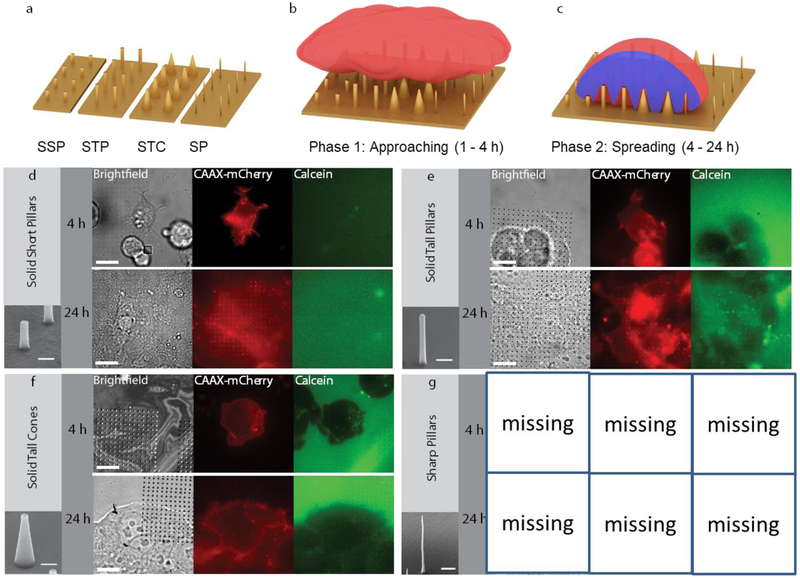
Figure 1.
Schematic and fluorescence imaging of penetration. a) 3D sketch of the main nanostructures. b) Sketch of a cell approaching the nanostructures (< 4 h incubation). c) Sketch of a cell in adhesion on the different 3D nanostructures (< 24 h incubation). Images of Caax-mCherry-transfected HEK cells on d) SSPs, e) STPs, f) STCs, and g) SP after delivery of calcein. Brightfield images show where nanostructures are located with respect to the HEK cells. Cells on all nanostructures do not show uptake of membrane-impermeant calcein (green channel). Insets show SEM of the different structures. Scale bars 15 μm. Inset scale bars 500 nm. Enlarged versions of these images are available in supporting information (Fig. S13 to S15).

