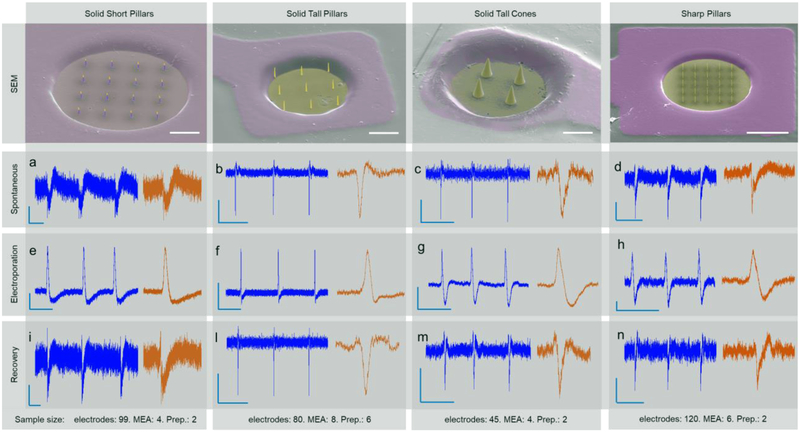
Figure 2.
SEM microscopy and electrophysiology with MEA electrodes with SSPs, STPs, STCs, and SPs. a-e-i) HL-1 action potentials recorded on SSP, respectively spontaneous activity, after electroporation and after recovery (Scale bars -- a, e: 20uV, 1s. i: 50uV, 1s). b-f-i) HL-1 action potentials recorded on STP, respectively spontaneous activity, after electroporation, and after recovery (Scale bars -- b, f: 0.1 mV, 0.5 s. i: 0.4 mV, 0.5 s). c-g-m) HL-1 action potentials recorded on STP, respectively spontaneous activity, after electroporation, and after recovery (Scale bars --c-g-m: 0.1 mV, 1 s.). d-h-n) HL-1 action potentials recorded on SP, respectively spontaneous activity, after electroporation, and after recovery (Scale bars -- d-h-n: 0.05 mV, 1 s.). Below each panel, the sample size for each nanostructure shape is indicated in terms of number of electrodes (considering only those recording activity), MEAs, and cell preparations.

