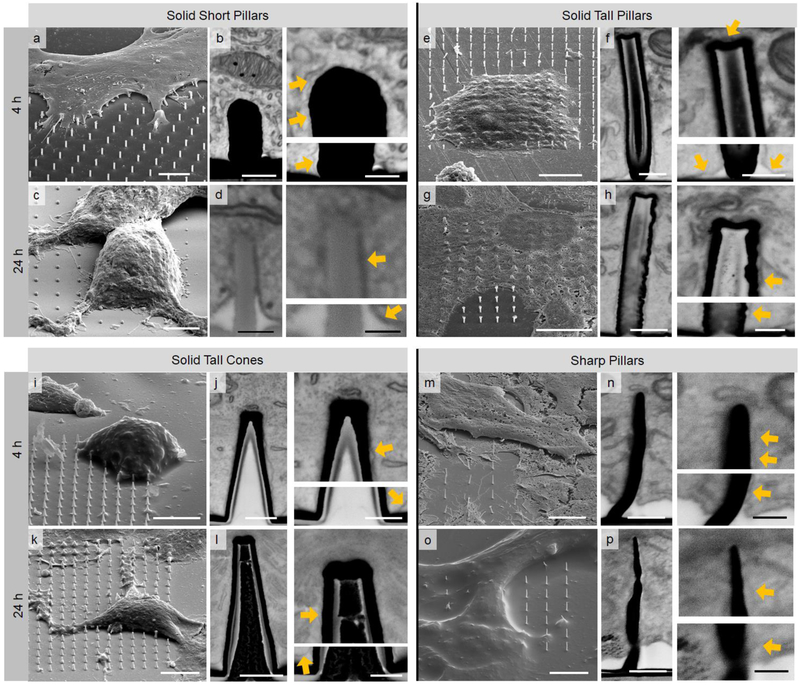
Figure 3.
SEM whole and cross-sectional images of HL-1 cultured and UTP-fixed on SSP, STP, STC, and SP. (Scale bars--a: 5 μm; b: left = 500 nm, right = 300 nm; c: 5 μm; d: left = 200 nm, right = 300 nm; e: 10 μm; f: left = 300 nm, right = 300 nm; g: 10 μm; h: left = 400 nm, right = 200 nm; i: 10 μm; j: left = 500 nm, right = 400 nm; k: 10 μm; l: left = 500 nm, right = 250 nm; m: 5 μm; n: left = 200 nm, right = 100 nm; o: 6 μm; p: left = 200 nm, right = 100 nm). Yellow arrows indicate the intact cell membrane in adhesion with the 3D nanostructures. Larger versions of all the SEM images are available in supporting information (Fig. S5 to Fig. S12).

