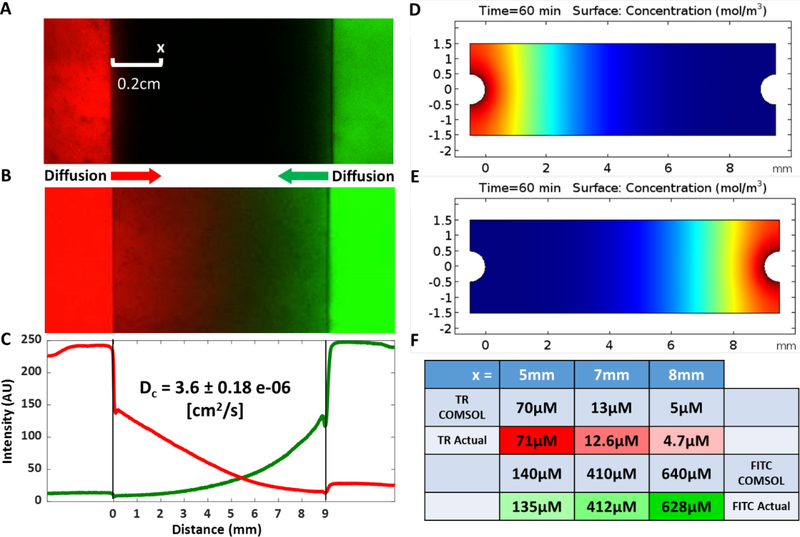
Figure 4:
The diffusion coefficient of a model large compound (fluorescently-labeled 10 kDa dextran) in the hydrogel scaffold was measured using confocal microscopy. (A) A fluorescent image of the experiment shows the left perfusion channel (red) and the right perfusion channel (green) under perfusion with a syringe pump. Fluorescence intensity of Texas red dextran at a spot 0.2 cm from the left channel was measured over time to determine the diffusion coefficient. (B-C) After 60 minutes of perfusion, opposing gradients of both Texas red- and FITC-dextran molecules were apparent. (D-E) Using the acquired diffusion coefficient, a COMSOL model was created to simulate Texas red dextran diffusion from the left port and FITC dextran diffusion from the right port. (F) Local concentrations of both dextrans obtained from the COMSOL simulation were validated experimentally at positions corresponding to x=5, 7, and 8 mm.

