Figure 7:
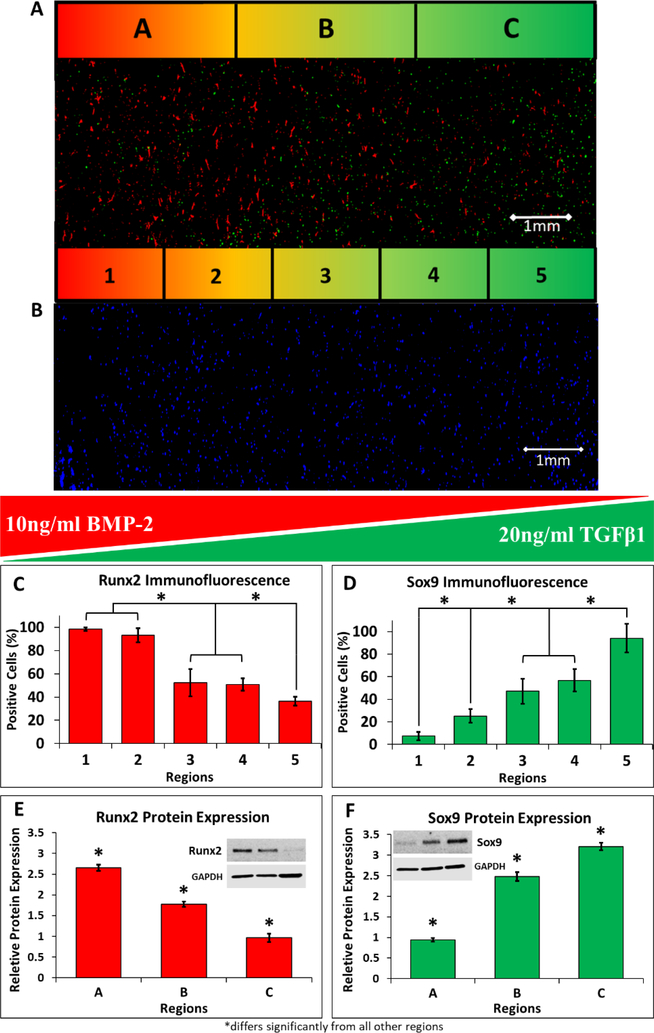
Opposing gradients of osteogenic and chondrogenic differentiation can be generated by delivery of soluble morphogens localized to isolated channels. (A) MSCs demonstrated gradient patterns of differentiation with respect to osteogenic and chondrogenic media. This representative immunofluorescence image shows spatially opposing gradients of osteogenic and chondrogenic differentiation of MSCs, with the highest level of Runx2 expression (red, marker of osteogenic cells) located near the osteogenic media channel (region 1) and more prominent Sox9 expression (green, marker of chondrogenic cells) located closer to the chondrogenic media channel (region 5). (B) A Hoechst nuclear counterstain was used to visualize the whole-cell population for normalization of the Runx2 and Sox9 positive cell counts. (C) Osteogenic differentiation induced by 10 ng/ml BMP-2 had the highest immunofluorescence expression of the differentiation protein Runx2 in region 1 and significantly decreased as distance increased from the source channel (regions 2–5). (D) Similarly, chondrogenic differentiation induced by 20ng/mL of TGFβ1 had the highest immunofluorescence expression of the differentiation protein Sox9 in the region closest to the chondrogenic media channel (region 5) and significantly decreased further away from the source channel (regions 1–4). (C-D) The immunofluorescence results were further validated by protein expression measured by Western blot. The highest expression of Runx2 (E) occurred nearest to the osteogenic media channel (region A), and significantly decreased as distance increased (regions B and C). The highest expression of Sox9 (F) was measured nearest to the chondrogenic media channel (region C), and significantly decreased further away from the source channel (regions A and B). *p<0.05, n=10 hydrogels.

