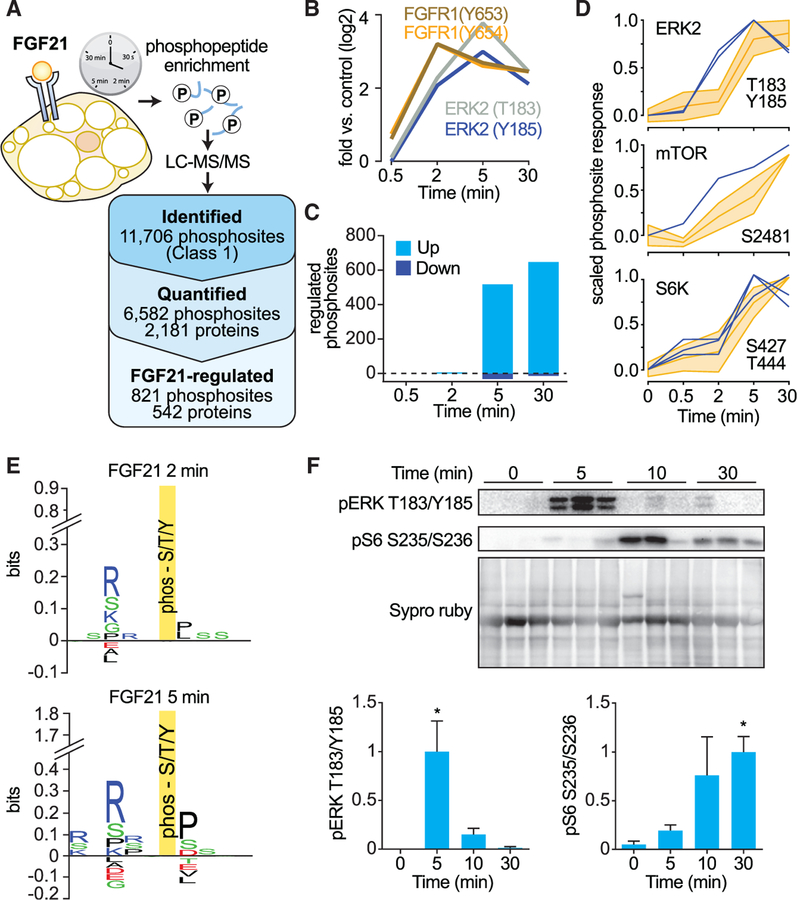
Figure 1. Phosphoproteomic Analysis of FGF21 Reveals mTORC1 Is a Major Signaling Node.
(A) Experimental design of the FGF21 phosphoproteome. SILAC-labeled 3T3-L1 adipocytes were serum starved for 1.5 hr and treated with FGF21 over a time course. Proteins were extracted and digested with trypsin. Peptides were fractionated by SCX chromatography, and phosphopeptides were enriched using TiO2 chromatography. Phosphopeptide fractions were analyzed by MS. The number of phosphorylated proteins and phosphosites identified, quantified, and FGF21 regulated (adj. p < 0.05, fold change < 0.67 or fold change > 1.5) are shown.
(B) FGF21-mediated phosphorylation of FGFR1 (Y653, Y654) and MAPK1 (T183, Y185).
(C) Number of significantly regulated phosphosites at each time point (adj. p < 0.05, fold change < 0.67 or fold change > 1.5).
(D) Phosphorylation profile of the kinase activation site (blue) and substrates (yellow).
(E) Sequence logos for phosphorylation sites that were FGF21 regulated at 2 and 5 min.
(F) Mice were intraperitoneally injected with FGF21, and white adipose tissue was collected at indicated time points. Fat was immunoblotted for indicated proteins and stained for total protein by Sypro Ruby as a loading control. Immunoblots were quantified and normalized to total protein and average maximal response (n = 6, mean ± SEM, one-way ANOVA, *p < 0.01).

