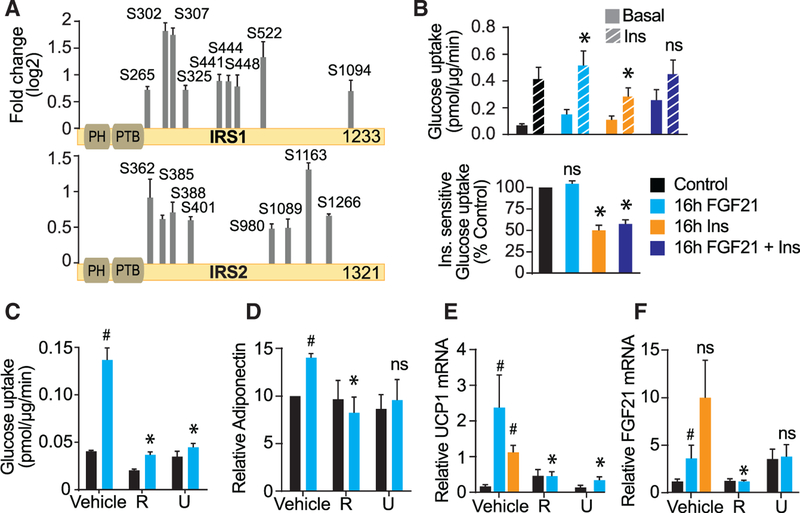
Figure 3. mTORC1 Mediates the Beneficial Actions of FGF21 in Adipocytes.
(A) FGF21-regulated phosphorylation sites are depicted on IRS1 and IRS2 (adj. p < 0.05, fold change > 1.5 at any time point). The y axis represents log2 FC after 30 min of FGF21 stimulation (n = 3, mean ± SEM).
(B) 3T3-L1 adipocytes were treated with 10 nM insulin, 23 nM FGF21, or both for 16 hr, serum starved for 2 hr, and then assayed for glucose uptake without (basal) or with (10 nM) insulin for 30 min (n = 5, mean ± SEM, two-way ANOVA, *p < 0.01 versus insulin-stimulated control). Bottom: insulin-sensitive glucose uptake (∆ insulin-basal) is shown. Data are normalized to control (n = 5, mean ± SEM, one-sample t test, *p < 0.01).
(C–F) 3T3-L1 adipocytes (C) or subcutaneous adipocytes differentiated in vitro (D–F) were treated for 16 hr with 23 nM FGF21, 10 nM insulin, 500 nM rapamycin (R), or 10 μM U0126 (U). (C) Cells were serum starved and glucose uptake was assessed using [3H]2DOG (n = 3). (D) Adiponectin secreted into cell culture media was detected by immunoblotting, and immunoblots were quantified and normalized to basal (n = 4). (E and F) FGF21 and UCP1 mRNAs were determined and normalized to basal (n = 8 for control and FGF21-treated cells, n = 5 for insulin-treated cells). Data presented are mean ± SEM. *p < 0.05 by two-way ANOVA versus FGF21-treated cells. #p < 0.01 one-way ANOVA versus untreated cells or for (D) one sample t test. NS, non-significant.

