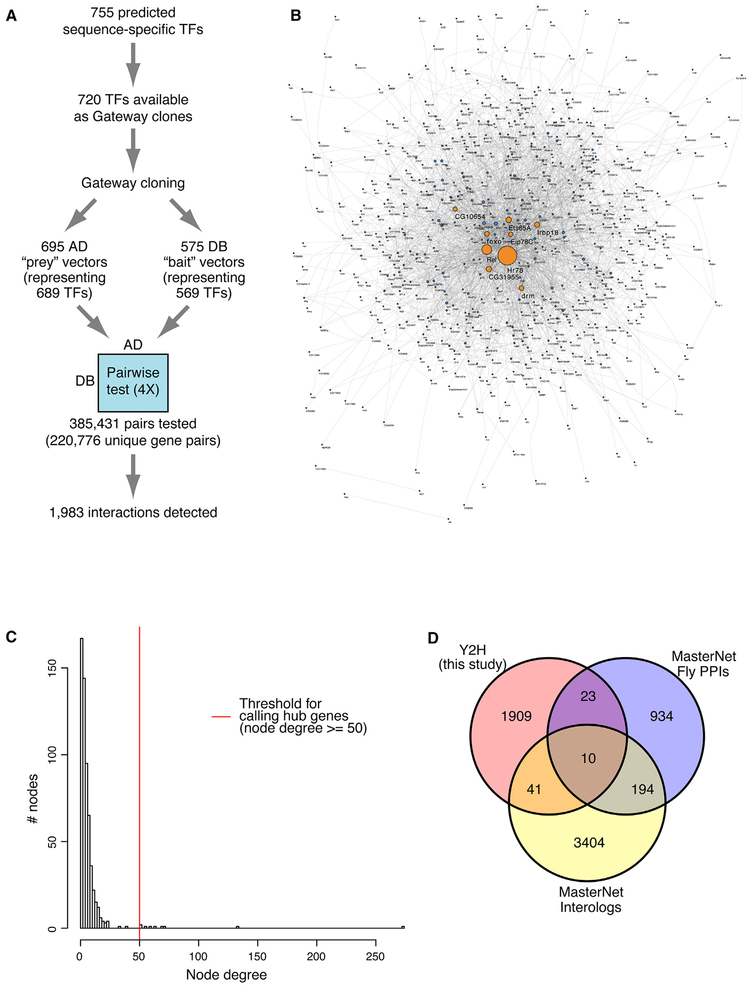
Figure 1. Comprehensive Drosophila Y2H TF-TF Interactome.
(A) Overview of the Y2H screen.
(B) Network view of the Y2H TF-TF interactome.
(C) Degree distribution of the Y2H interactome. Median degree, 4; mean degree, 6.79. The red vertical line indicates the threshold for calling hub genes (degree, 50).
(D) Comparisons of identified interactions with those in MasterNet.

