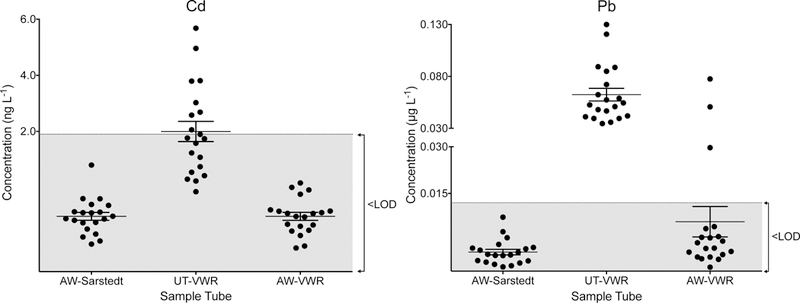
Figure 2.

Concentrations of Cd and Pb are plotted in 1) acid-washed Sarstedt autosampler vials (AW-Sarstedt); 2) untreated VWR tubes (UT-VWR); and 3) acid-washed VWR tubes (AW-VWR). For each group, the individual data points (filled circles) are shown along with the mean ± 95% CI.
