
Figure 5.
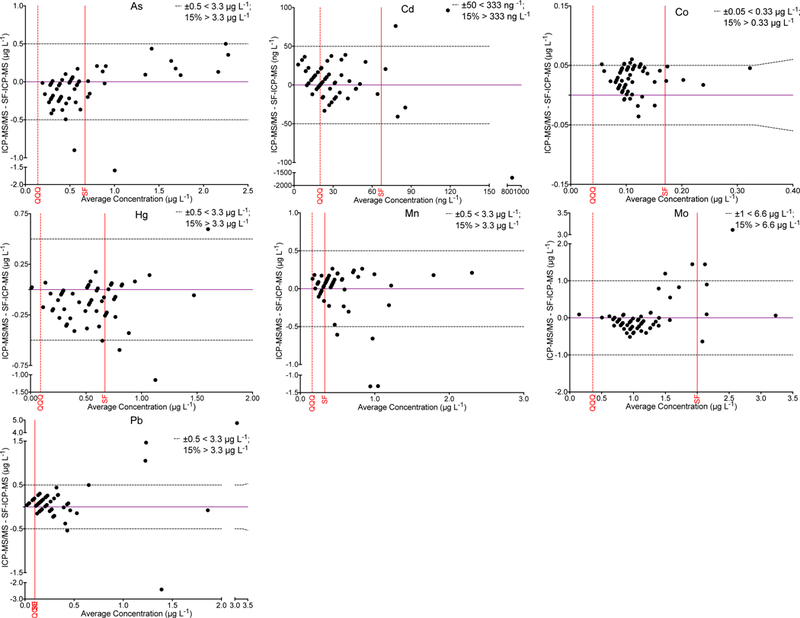
The difference between values obtained by ICP-MS/MS (QQQ) and SF-ICP-MS is shown as a function of the mean concentration of As, Cd, Co, Hg, Mn, Mo, and Pb in 60 common samples. For these elements a large proportion of the data were below the method LOQ for either the ICP-MS/MS method or the SF-ICP-MS method. Thus, acceptability criteria (black dashed lines) are proposed as ± an absolute criterion (shown per element) or ±15%, whichever is greater. Method LOQs are shown for the QQQ method (red dashed line) and SF method (solid red line).