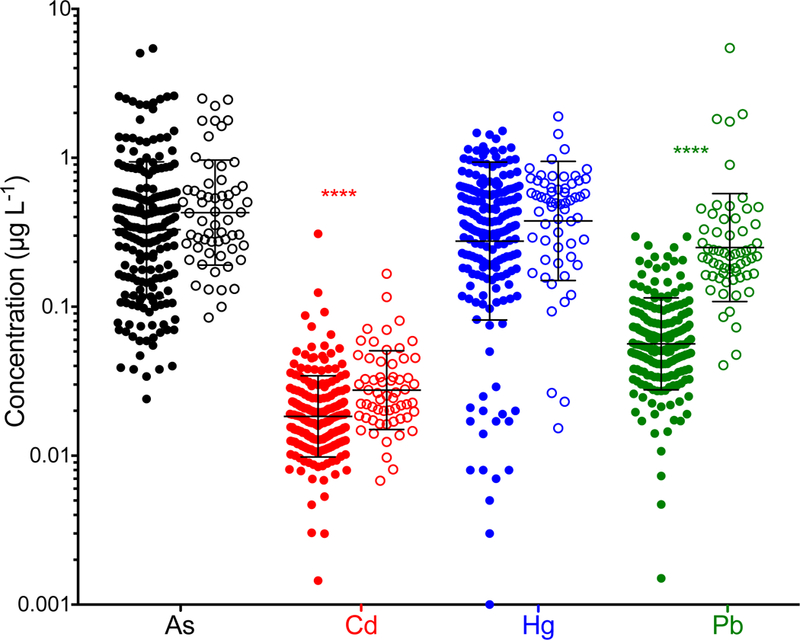
Figure 7.

Values obtained by ICP-MS/MS for As (black), Cd (red), Hg (blue), and Pb (green) in the 197 FF samples measured as part of the present study (filled in circles) compared to those measured in 60 of the FF samples that were originally measured by SF-ICP-MS (open circles). The geometric mean ± geometric standard deviation are shown for each group.
