
3.
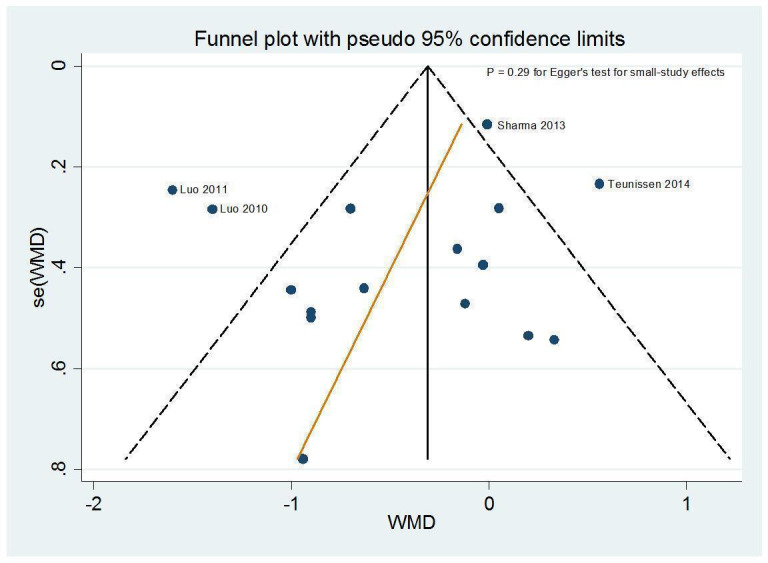
Funnel plot of the weighted mean difference (WMD) of length of hospital stay (days) against its standard error. The circles represent risk estimates of each study, and the black vertical line represents the pooled effect estimate. Dashed lines represent pseudo‐95% confidence limits. Egger test (P = 0.29) suggests no small‐study effects.