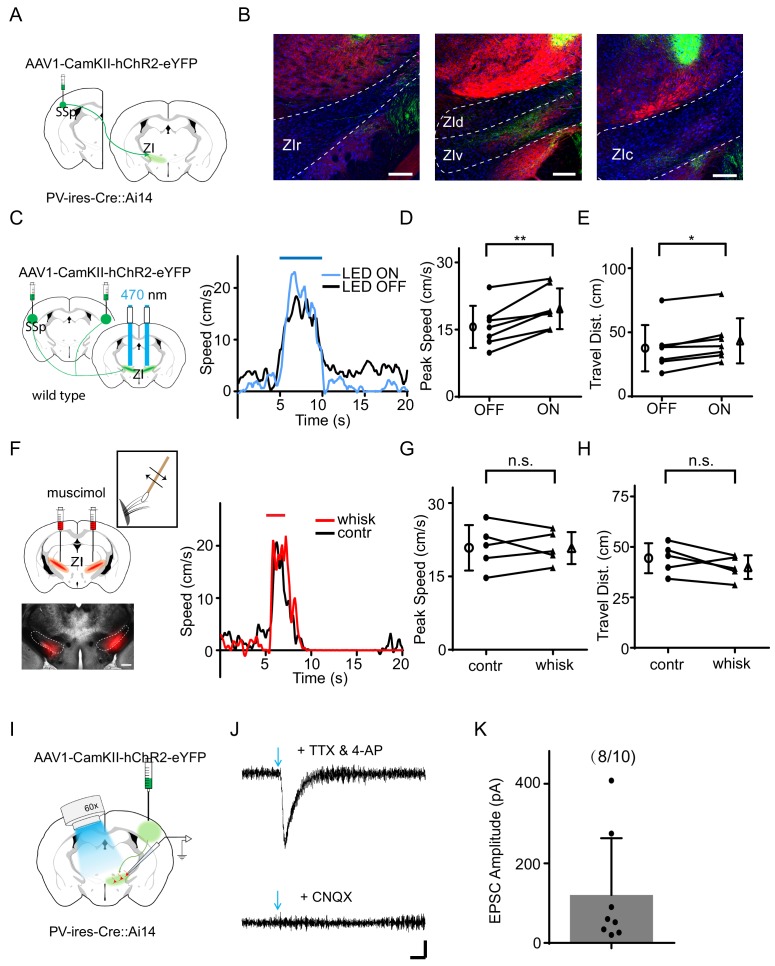
Figure 2. The SSp-ZIv projection mediates the tactile enhancement of sound-induced flight.
(A) Illustration of the injection paradigm. (B) Anterogradely labeled axon terminals in rostral (left), dorsal and ventral (middle), as well as caudal (right) sectors of ZI. Scale bar, 200 µm. Blue shows Nissl staining; red shows PV+ neuron or axon distribution. (C) Left, illustration of the experimental paradigm: optic fibers were implanted to stimulate ChR2-expressing SSp axons in ZI. Right, plots of speed without (black) and with (blue) LED stimulation for an example animal. (D) Summary of peak noise-induced speed in the absence and presence of LED stimulation of SSp-ZI terminals. **p=0.003195, two-sided paired t-test, n = 7 animals. (E) Summary of the travel distance. *p=0.01854, two-sided paired t-test, n = 7 animals. (F) Left, ZIv was silenced with muscimol (red) as shown in the confocal image (lower, scale: 500 µm). Right, plots of speed without (black) and with (red) whisker stimulation for an example animal. (G) Summary of peak speed in the absence and presence of whisker stimulation. ‘n.s.”, not significant, two-sided paired t-test, n = 5 animals. (H) Summary of total travel distance. ‘n.s.”, not significant, two-sided paired t-test, n = 5 animals. (I) Experimental paradigm for slice recording. (J) Average LED-evoked EPSC in an example ZIv PV+ neuron before and after (lower) perfusion of CNQX. Arrow points to the onset of LED light. Recording was made in the presence of TTX and 4-AP. Scale: 25 pA, 25 ms. (K) Amplitudes of LED-evoked EPSCs of 8 responding neurons out of 10 recorded ZIv PV+ cells. Bars represent s.d. for all panels.


