
Figure 2. Notch regulates CDX2 in the early morula.
(A–B) Normalised expression of Cdx2, Gata3, Oct4 and Nanog in pools of 25 embryos treated with RO4929097 to inhibit Notch (left) or with Verteporfin to inhibit YAP/TEAD interaction (right), from the 2 cell to morula stage (A; Notch inhibition, n = 6); YAP/TEAD inhibition, n = 6–9) or from morula to blastocyst stage (B; Notch inhibition, n = 4–6; YAP/TEAD inhibition, n = 6–11). n represents number of unique pools of 25 embryos. Pools of embryos treated with DMSO were used as controls. * p-value<0.05 by Student’s t test. (C) Maximal projections of confocal images after immunostaining of CDX2 in wildtype and Rbpj-/- early morulae. (D) Violin plots of CDX2 intensity levels and (E) quantification of number of CDX2 positive cells in wildtype and Rbpj-/- early morulae (n = 11 embryos). (F) Maximal projections of confocal images after immunostaining of CDX2 in wildtype and Rbpj-/- late morulae. (G) Violin plots of CDX2 intensity levels and (H) quantification of number of CDX2 positive cells in wildtype and Rbpj-/- late morulae (wildtype, n = 4 embryos; Rbpj-/-, n = 5 embryos). Nuclei were stained with DAPI. Scale bar, 20 μm. Data are means ± s.d. ***p<0.001 by Student’s t test (D) or by Fisher’s exact test (E).

Figure 2—figure supplement 1. CBF1-VENUS levels decrease upon Notch inhibition.
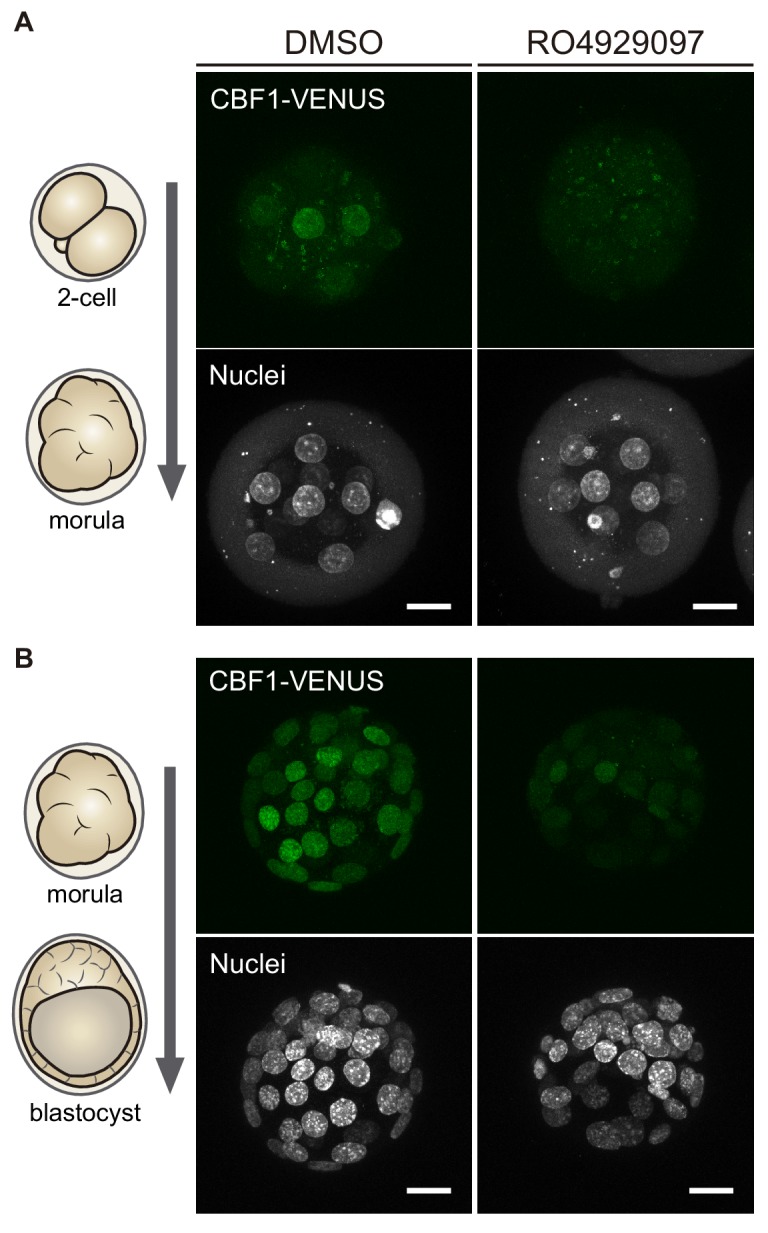
Figure 2—figure supplement 2. Downregulation of CDX2 in Notch1-/- early morulae.
