. 2019 Apr 8;8:e42930. doi: 10.7554/eLife.42930

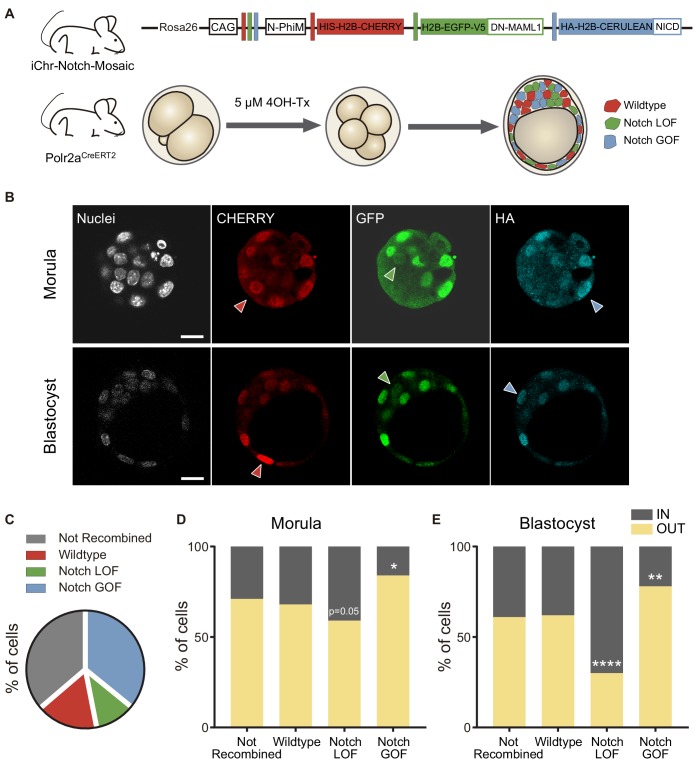
Figure 4. Differences in Notch activity drive cell fate in the preimplantation embryo.

(A) Schematic diagram of the experimental strategy, where iChr-Notch-Mosaic mice were crossed with Polr2aCreERT2 driver. Embryos were collected and treated with 4OH-Tamoxifen from 2- to 4-cell stage to induce recombination. At morula and blastocyst stage, embryos were fixed and immunostained. (B) Optical section of confocal images after immunostaining for RFP, GFP and HA. Arrowheads indicate examples of cells recombined for the wildtype cassette (red), the Notch loss of function cassette (LOF, green) or the Notch gain of function cassette (GOF, blue). Nuclei were stained with DAPI. Scale bars, 20 μm. (C) Percentage of not recombined cells or recombined for each cassette in morulae (n = 10) and blastocysts (n = 11). (D–E) Percentage of not recombined cells or recombined for each cassette that are in an inner or outer position at the morula (D; not recombined, n = 69; wildtype, n = 33; LOF, n = 29; GOF, n = 83) or blastocyst stage (E; not recombined, n = 190; wildtype, n = 87; LOF, n = 50; GOF, n = 173). *p<0.05, **p<0.01, ****p<0.0001 in relation to not recombined cells by Chi-square test.

Figure 4.

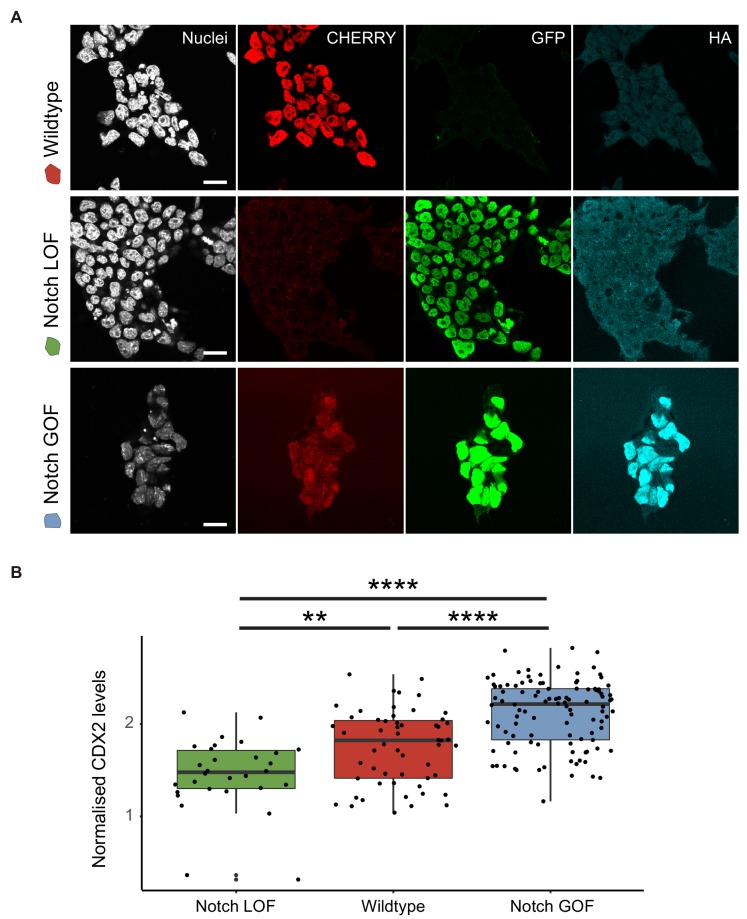
Figure 4—figure supplement 1. Differences in Notch activity correlate with CDX2 levels.

Figure 4—figure supplement 1.

(A) Confocal images after immunostaining for CHERRY, GFP and HA of sorted cell populations from the iChr-Notch-Mosaic ES cell line according to the colour of each cassette (wildtype, red; Notch LOF, green; Notch GOF, cerulean). Nuclei were stained with DAPI. Scale bars, 20 μm. (B) CDX2 intensity levels of Notch LOF, wildtype and Notch GOF blastomeres in blastocysts from the iChr-Notch-Mosaic mouse line. **p<0.01; ****p<0.0001 by ANOVA with Tukey post-test. Notch LOF, n = 30 blastomeres; wildtype, n = 55 blastomeres; Notch GOF, n = 106 blastomeres from six blastocysts.
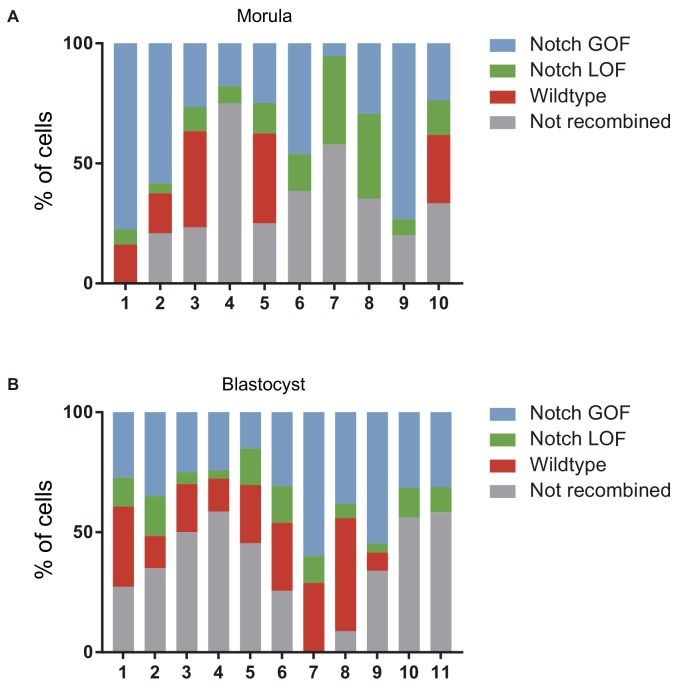
Figure 4—figure supplement 2. Confronting Notch activity levels in the preimplantation embryo.

Figure 4—figure supplement 2.

(A–B) Percentage of cells recombined for each cassette (wildtype, red; LOF, green; GOF, cerulean) or not recombined in individual morulae (A) or blastocysts (B) from the iChr-Notch-Mosaic mouse line.
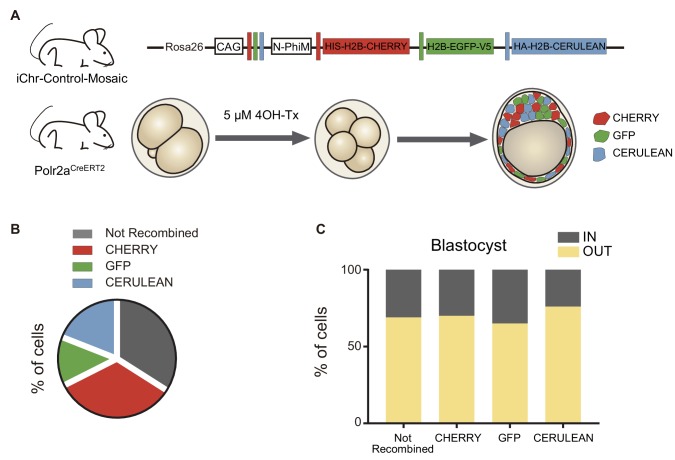
Figure 4—figure supplement 3. Distribution of recombination events in a control mosaic mouse line.

Figure 4—figure supplement 3.

(A) Schematic diagram of the experimental strategy, where iChr-Control-Mosaic mice were crossed with Polr2aCreERT2 driver. Embryos were collected and treated with 4OH-Tamoxifen from 2- to 4-cell stage to induce recombination. (B) Percentage of not recombined cells or recombined for each cassette (n = 12 embryos). (C) Percentage of not recombined cells or recombined for each cassette that are in an inner or outer position at the blastocyst stage (not recombined, n = 218; CHERRY, n = 215; GFP, n = 86; CERULEAN, n = 122).