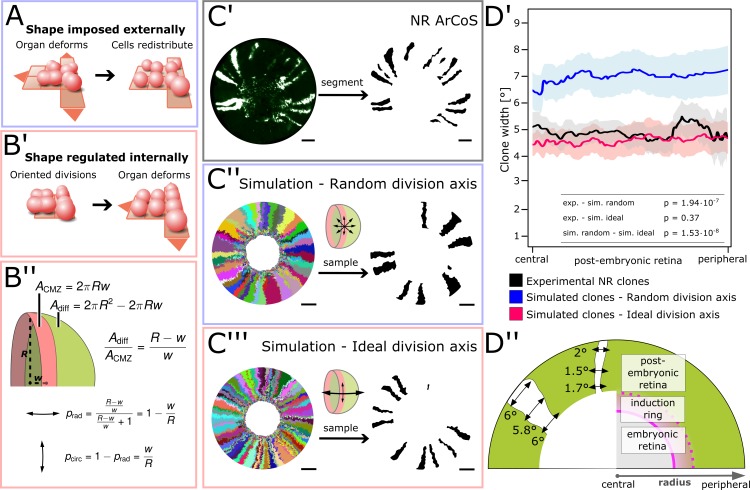
Figure 5. NR stem cells undergo predominant radial divisions as predicted for a shape-giving function.
(A) If organ shape is imposed externally, then cells in the tissue will distribute to fill the available space. Regardless of cell division axes, organ geometry will lead to a directional growth in stripes. (B’) If organ shape is regulated by cell division axes, then oriented divisions are required. (B’’) If the NR regulates shape through cell divisions, then more divisions along the radial axis are needed to maintain hemispherical geometry. (C’–C’’’) Examples of experimental and simulated data. For simulations, the full clone population and a random sample are shown. The initial model label was induced at R = 150 µm to match the experimental induction radius. Scale bars: 200 µm. (D’) Mean clone width (solid lines) and 95% confidence intervals (shaded) plotted along the post-embryonic retinal radius. Experimental data: n = 99 ArCoS across seven retinae. Simulation, random division axis: n = 102 ArCoS from five simulations; ideal division axis: n = 133 ArCoS from five simulations. p values were calculated with Welch two sample t-test. (D’’) Schematic of radial compartments of the NR and measurements of clone width in proximal view. The clone width plotted in D’ corresponds to the angle enclosed by the clone borders at every radial position.


