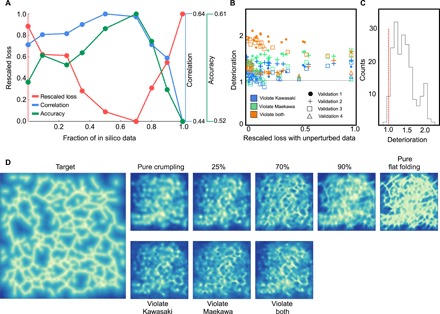
Fig. 5. Effect of fraction generated data.

(A) Three quantifications of the predictive power of the model when trained on varying amounts of generated data and a constant amount of crumpling data. Strong predictive power corresponds to low loss (red) and large Pearson correlation and classification accuracy (blue and green, respectively). (B) Deterioration (see main text) for each sheet in the validation set, as a function of the rescaled loss. Colors correspond to different perturbations and marker styles to cross-validation sample. It is seen that all tested perturbations lead to worse predictive power (above the gray reference line). The few points below the reference line occur at high crumple number and low absolute loss. (C) Histogram of all points in (B). Values to the right of the red line correspond to deterioration when using unphysical data. (D) Example target and predictions for the various models considered in previous panels.
