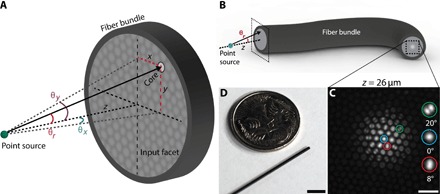
Fig. 1. Imaging a point source with an optical fiber bundle.

(A) Schematic of point source placed a distance z from the input (distal) facet of a bare optical fiber bundle. A ray traveling from the point emitter to an arbitrary core on a fiber facet with an angle of incidence of θr is shown. Angles θx and θy are also defined here. (B) A schematic of a fiber bundle showing its input (left side) and output facets (right side). The image of a point source is transmitted through the bundle cores to the output facet. A zoomed-in view of the input facet geometry is shown in (A). (C) Example raw image of the distal facet when observing a fluorescent bead at a depth of z = 26 μm from the input facet. The bead diameter is smaller than the core diameter, and therefore, the bead approximates a fluorescent point source. Three example cores are expanded in the inset and displayed along with the angle of incidence of input light, calculated from the known bead depth (see “Beads” section) and location of the core on the facet. Scale bar, 10 μm. (D) Photograph of the optical fiber bundle used in this work (diameter, 750 μm; 30,000 cores) next to an Australian five-cent coin. Scale bar, approximately 5 mm.
