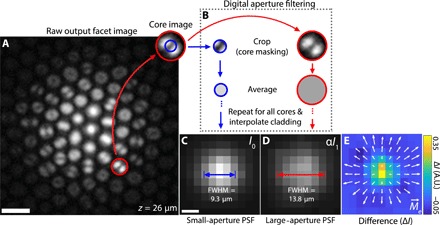
Fig. 2. Digital aperture filtering.

(A) Example raw output facet image from an optical fiber bundle for a fluorescent bead at a distance of z = 26 μm from the input facet. Scale bar, 5 μm. (B) Image of the mode pattern within a single core. The red and blue circles indicate example averaging regions for large- (full) and small-aperture images, respectively. Traditional large-aperture images are created by averaging the entire region circled in red for each core and then filling in the missing region between cores [dark cladding in (A)] via linear interpolation. A large-aperture image is what is traditionally obtained using fiber bundle depixelation techniques. Small-aperture images are created in the same way, with an average taken over the smaller blue circle. (C) Small-aperture image (I0) of a fluorescent bead at z = 26 μm after cladding interpolation. Scale bar, 5 μm. (D) Intensity-scaled large-aperture image (αI1) of a fluorescent bead at z = 26 μm after cladding interpolation. The scaling constant α is chosen such that the total intensity of (C) and (D) are equal. See section S1 for details. PSF full width at half maximum (FWHM) for small and large apertures are indicated in (C) and (D), respectively. (E) Difference between small-aperture and (intensity-scaled) large-aperture images. Arrows show the effective light field moment vector field . A.U., arbitrary units.
