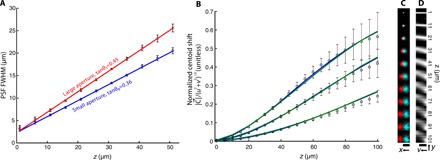
Fig. 3. Imaging model quantification.

(A) PSF full width at half maximum (FWHM) for fluorescent beads located 1 to 51 μm from the fiber facet. Square (red) and circle (blue) datapoints are obtained via 2D Gaussian fits to the full aperture of the fiber bundle tanθ1 and the synthetically reduced fiber bundle collection aperture tanθ0, respectively. Error bars correspond to the FWHM SD over five beads. Red and blue lines are linear fits to the large- and small-aperture datasets, respectively. The slope of the fits represents the effective aperture of the fiber bundle: tanθ1 = 0.4534 (95% confidence bounds, 0.4436 to 0.4632) and tanθ0 = 0.3574 (95% confidence bounds, 0.3496 to 0.3652). The y intercept (denoted by σ0) is the FWHM of a bead located on the fiber facet due to finite sampling density of the fiber cores: σ0 = 2.322 μm (95% confidence bounds, 2.095 to 2.517 μm) and σ0 = 2.281 μm (95% confidence bounds, 2.027 to 2.534 μm) for large and small apertures, respectively. (B) Fluorescent bead centroid shift (disparity) as a function of bead depth for h = 75, 100, and 150 μm. Centroid shift is reported as the magnitude of the centroid shift in xy-space per unit displacement in uv-space (see Eq. 5). Datapoints are experimentally measured values, and error bars represent the SD over five beads. Blue and green curves are theoretical (following Eq. 5) and simulated centroid shifts, respectively. The SE in depth as a function of true depth is shown in fig. S6. (C) Extreme left- and right-viewpoint images of fluorescent beads at increasing depths. Image is viewable with red-cyan 3D glasses. Scale bar, 25 μm. (D) Central yv epipolar slice (x = 0, u = 0) of the light field for each bead depth. Scale bar, 25 μm.
