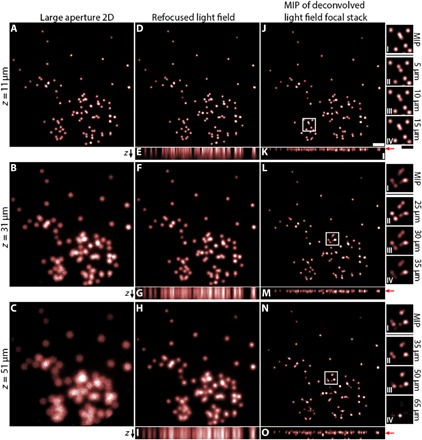
Fig. 4. Light field refocusing and deconvolution.

(A to C) Traditional large-aperture 2D images for a planar fluorescent sample consisting of fluorescent beads. (D to I) Refocused light field images of the same sample. (J to O) Maximum intensity projections (MIPs) of deconvolved light field focal stack, for the same sample. The sample is placed at a distance of z = 11, 31, and 51 μm from the fiber facet in the first, second, and third rows, respectively. xz MIPs for the light field and deconvolved light field are shown for each object depth in (E), (G), (I), (K), (M), and (O), respectively. Red arrows indicate the ground truth z-position of the bead sample. See fig. S7 for horizontal projections of (E), (G), (I), (K), (M), and (O). Scale bars, 50 μm (J and K). Insets I to IV for (J), (L), and (N) show zoomed-in images of the boxed regions of (J), (L), and (N) for the deconvolved light field focal stack near the ground truth object plane. Some features that are blended together in the MIP image are resolvable in deconvolved refocused planes near the true object plane. All images are intensity-normalized for visibility. Inset scale bar, 25 μm (J, inset IV).
