
Fig. 5. Visualizing depth in 3D samples.
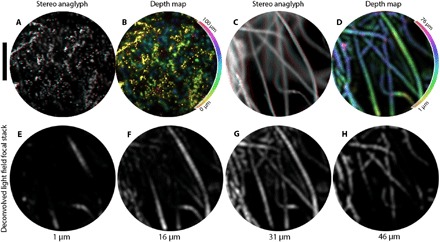
(A) Red-cyan stereo anaglyph of a 3D sample of fluorescent beads, viewable with red-cyan stereo glasses. The sample has a thickness of ~55 μm as verified by confocal microscopy and is placed 5 μm from the fiber facet. (B) Calculated depth map for the sample in (A), with depth color-coded by hue (see colorbar); pixel brightness is set to the pixel brightness in the [u, v] = [0, 0] viewpoint image. For a comparison between the ground truth confocal image and this depth map, see fig. S8. (C) Red-cyan stereo anaglyph of lens paper tissue with highlighter ink. (D) MIP depth map of the sample in (C). The depth of maximum intensity is color-coded by hue. Virtual reality goggle compatible stereo-pairs of (A) and (C) are available in fig. S9. (E to H) Slices of the deconvolved light field focal stack for fluorescent lens paper at depths of 1, 16, 31, and 46 μm, respectively. Scale bar, 200 μm.