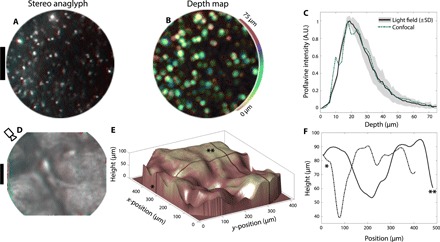
Fig. 6. Depth mapping of biological tissue.

(A) Red-cyan stereo anaglyph of a proflavine-stained brain slice with a thickness of ~5 mm. Topically applied proflavine highlights cell nuclei. A viewpoint shifting animation along the x axis is shown in movie S7. Scale bar, 100 μm. (B) Light field depth map for the field of view in (A), with depth color-coded as hue (see colorbar). Pixel brightness is set to the depth confidence at each pixel. (C) Proflavine intensity distribution as a function of depth, measured from light field data (solid black curve), and from confocal data (blue dashed curve). Light field data are averaged over 25 separate fiber bundle fields of view. The gray area above and below the black curve indicates 1 SD above and below the mean proflavine intensity depth distribution, taken over 25 fiber bundle fields of view. The finite penetration depth of topically applied proflavine is apparent in both light field and confocal datasets, with good agreement in the distribution shape between the two imaging approaches. (D) Red-cyan stereo anaglyph of skin surface autofluorescence (thumb, near the knuckle). The camera icon indicates viewing orientation in (E). A viewpoint shifting animation along the x axis is shown in movie S8. Scale bar, 100 μm. (E) 3D surface plot of data from (D), using shape from focus (31). Dark lines with “*” and “**” symbols indicate positions for height plots in (F). (F) Height along lines designated by (*, dashed) and (**, solid) in (E).
