
Fig. 2. Indirect excitonic lasing characteristics.
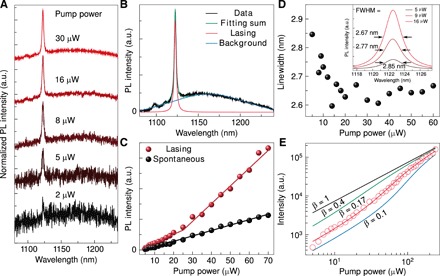
(A) Steady-state PL emission spectra with increasing pump intensity around the threshold, illustrating the phase transition from spontaneous emission to stimulated emission. (B) Cavity lasing emission as compared to the heterobilayer PL background. Green line represents Lorentzian fits to the experimental data (black line), while red and blue lines represent the lasing component and background component, respectively. (C) L-L curve showing the output intensity at the laser wavelength as a function of the excitation pump power. The cavity mode emission (red dots) exhibits a kink, indicating the onset of superlinear emission and lasing operation, while the heterobilayer PL background emission (black dots) shows a linear dependence on the pump intensity. Solid lines are the linear fit to the experimental data. (D) The linewidth of the cavity mode emission as a function of the pump power. Inset: Cavity mode emission peaks with increasing pump power, exhibiting a linewidth narrowing behavior. (E) Log-log plot of the cavity mode emission intensity as a function of the pump power. Solid lines are the simulated results of a rate equation calculation with different β factors. Red line shows the best fit to the experimental data (red circles) corresponding to β = 0.17. The fits of 0.1, 0.4, and 1 are also shown for comparison.