
Fig. 3. ABF locally enhances NP transport.
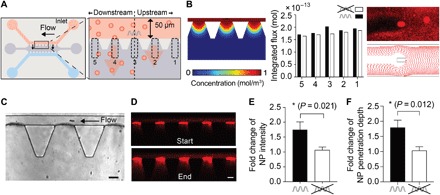
(A) Schematic of the microfluidic device (left) and conceptual sketch of experiment with numbered regions of interest, areas 1 to 5 (right). The ABF was controlled such that it maintained its position at the center of the channel (above area 3) by swimming upstream against the flow. (B) Simulated flux and simulated particle tracking in vicinity of the ABF. Left: Snapshot of the simulated concentration at three outlets upstream, downstream, and at the ABF. The bar graph in the middle quantifies the flux in the outlet areas for the five regions of interest in the vicinity of the ABF integrated over 1000 s (black) and for the same outlets in a control channel without ABF (white) based on Eulerian computational modeling. Right: A snapshot of an experiment showing the effect of the ABF on particle trajectories downstream (top) and a snapshot of such particle trajectories derived from Lagrangian computational modeling using the particle tracing interface in COMSOL Multiphysics. Although the effect of the ABF is captured as symmetric in fluid flow simulations based on Eulerian modeling, particle tracing simulation experiments indicate a slight asymmetry with stronger effects downstream of the ABF. (C) Bright-field image of an ABF in a microfluidic channel showing three outlets. (D) Fluorescence images at the beginning (top) and end (bottom) of an experiment, capturing the transport of 200-nm red fluorescent NPs into collagen. Scale bar, 50 μm. (E) Fold increase in fluorescence intensity of areas 2 to 5 compared to upstream control, area 1 (n = 9; *P < 0.05, Student’s t test; ratio of mean intensity change over areas 2 to 5 to area 1). In the presence of a rotating ABF (black bar), a 1.75-fold increase in fluorescence intensity was measured. (F) Overall increase in penetration depth Δd was quantified by measuring the distance at which fluorescence intensity fell to 1/e of its maximum value at the channel wall at the start and end of the experiment. The mean penetration depth of areas 2, 3, 4, and 5 exhibited a 1.73-fold increase relative to area 1 (n = 9; *P < 0.05, Student’s t test; ratio of mean penetration depth change over area 5 to 2 to area 1).