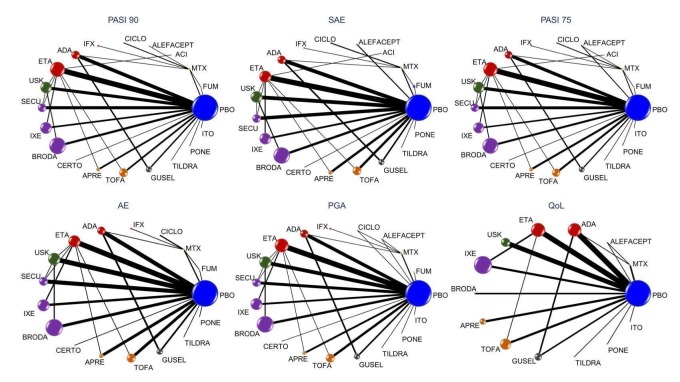
Figure 5.
Network plot for all the outcomes at drug‐level
The size of the nodes is proportional to the total number of participants allocated to each intervention and the thickness of the lines proportional to the number of studies evaluating each direct comparison.
ACI: acitretin; ADA: adalimumab; APRE: apremilast; BRODA: brodalumab; CERTO: certolizumab; CICLO: ciclosporin; ETA: etanercept; FUM: fumaric acid; IFX: infliximab; ITO: itolizumab; IXE: ixekizumab; GUSEL: guselkumab; MTX: methotrexate; PBO: placebo; PONE: ponesimod; SECU: secukinumab; TILDRA: tildrakizumab; TOFA: tofacitinib; USK: ustekinumab
AE: adverse events; PASI: Psoriasis Area and Severity Index; PGA: Physician Global Assessment; QoL: quality of life; SAE: serious adverse events

