
Figure 32.
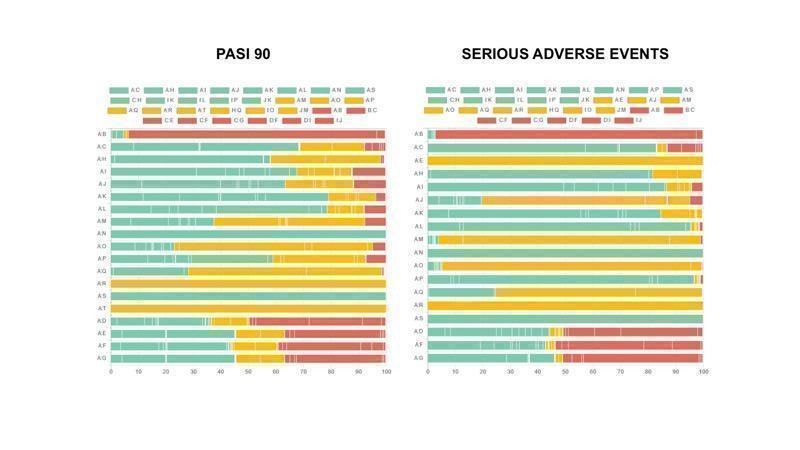
Study bias distribution for each primary outcome (PASI 90 and serious adverse events)
The following graphs show how much information (i.e. the percentage contribution of each direct comparison in the network estimates) comes from low (green), unclear/moderate (yellow) and high (red) risk of bias studies. Here we have all drugs versus placebo as it is difficult to have all comparisons due to space limitations. To evaluate the direct comparisons we used the mean level of bias of the included studies in each comparison.
We used the web application CINeMA (CINeMA 2017).
The codes of the treatments are A = Placebo, B = Fumaric acid esters, C = Methotrexate, D = Acitretin, E = Alefacept, F = Ciclosporin, G = Infliximab, H = Adalimumab, I = Etanercept, J = Ustekinumab, K = Secukinumab, L = Ixekizumab, M = Brodalumab, N = Certolizumab, O = Apremilast, P = Tofacitinib, Q = Guselkumab, R = Tildrakizumab, S = Ponesimod, T = Itolizumab