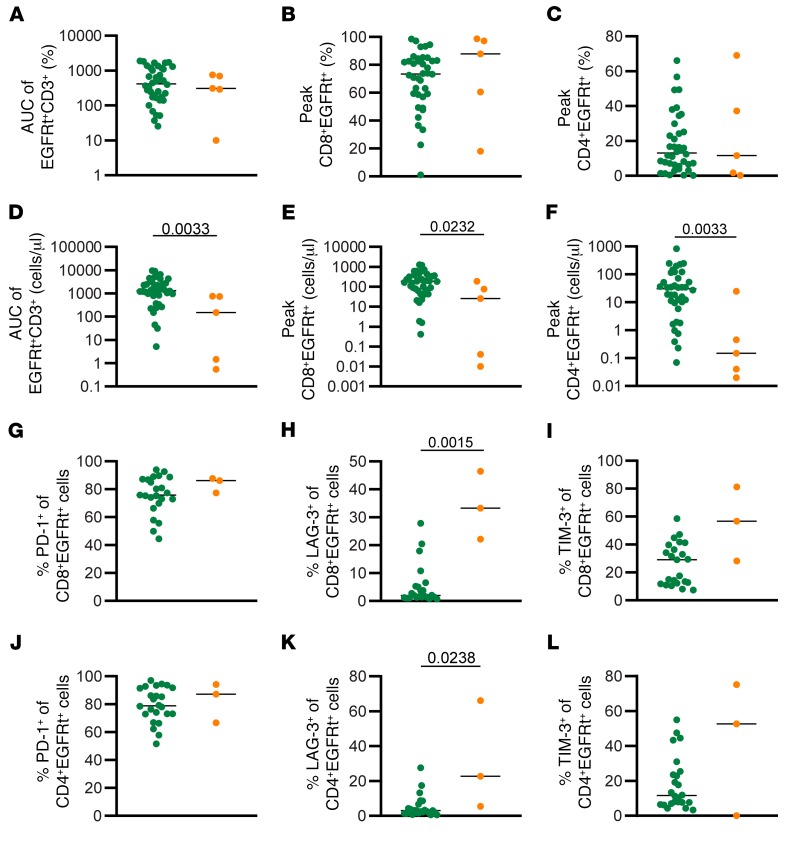
Figure 1. Expansion in dysfunctional response group is less robust than in functional response group.
(A) AUC of percentage of EGFRt+CD3+ cells in the peripheral blood between D0 and D63. Percentage of CD8+EGFRt+CD3+ cells (B) and CD4+EGFRt+CD3+ cells (C) in the peripheral blood at peak engraftment. (D) AUC of number of EGFRt+CD3+ cells per microliter in the peripheral blood between D0 and D63. Number of CD8+EGFRt+CD3+ cells (E) and CD4+EGFRt+CD3+ cells (F) per microliter in the peripheral blood at peak engraftment (n = 43). Percentage of CD8+EGFRt+ cells expressing PD-1 (G), LAG-3 (H), and TIM-3 (I) at peak expansion (n = 26). Percentage of CD4+EGFRt+ cells expressing PD-1 (J), LAG-3 (K), and TIM-3 (L) at peak expansion (n = 26). Bars represent the median. P values calculated using a Mann-Whitney test. Green circles: functional response; orange circles: dysfunctional response.

