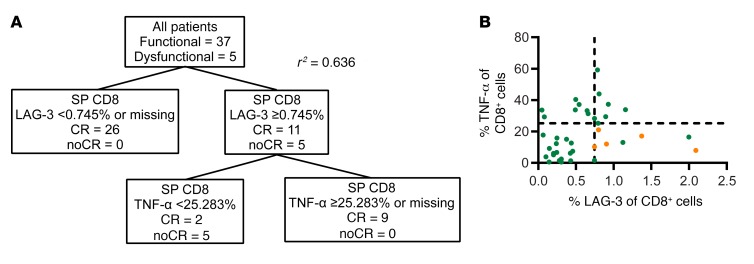
Figure 3. Phenotypic and functional characteristics of CD8+ SM associated with dysfunctional response.
(A) Clustering and regression tree analysis of CD8+ SM attributes. (B) Scatter plot representing the percentage of CD8+ SM cells expressing TNF-α and LAG-3 in the high antigen burden subjects (n = 40). Lines represent cutoff values determined by the tree analysis.

