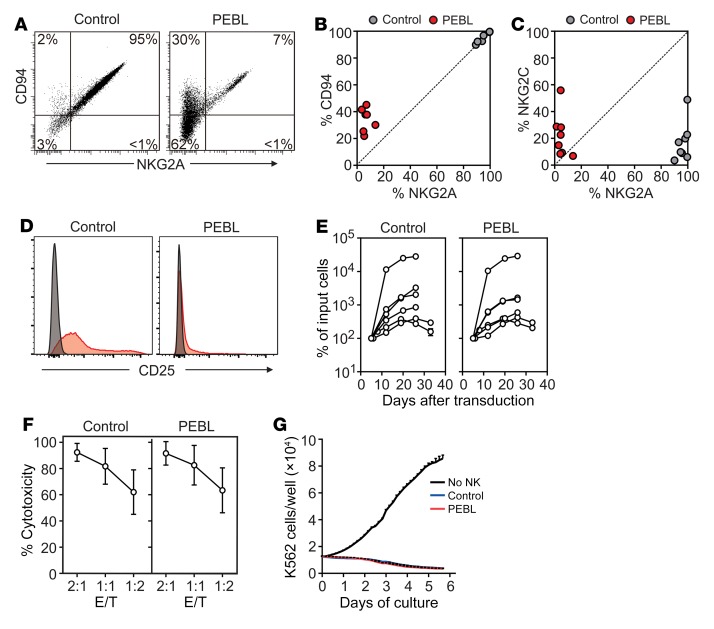
Figure 3. Phenotypic and functional effects of NKG2A downregulation by PEBL.
(A) Downregulation of NKG2A is accompanied by decrease of surface CD94 expression. Flow cytometry dot plots show expression of NKG2A (CD159a PE) and of CD94 (anti-CD94 APC) in a representative sample of NK cells expanded by coculture with K562-mb15-41BBL and transduced with either anti-NKG2A PEBL-2 or GFP alone (Control). (B) Summary of CD94 versus NKG2A expression results obtained with NK cells from 7 donors. (C) NKG2C (CD159c APC) versus NKG2A expression obtained with NK cells from 8 donors. (D) Expression of CD25 in PEBL-transduced and control NK cells. Flow cytometry histograms show expression of CD25 (red, detected with anti–CD25 PE-Cy7); staining with isotype-matched nonreactive antibody (mouse IgG1 PE-Cy7) is shown in gray. (E) Survival and expansion of PEBL-transduced and control NK cells from 6 donors cultured with IL-2 (400 IU/ml). Data are shown as mean (± SD) of triplicate measurements at each time point. (F) Results of 4-hour cytotoxicity assays performed against luciferase-labeled K562 cells. BrightGlo was added after 4 hours of coculture, and luminescence was measured using a Flx 800 plate reader. Data are shown as mean (± SD) of triplicate measurements with NK cells from 8 donors. (G) Long-term cytotoxicity of PEBL-transduced and control NK cells against mCherry-transduced K562 cells at 1:8 E/T. K526 cell growth was measured with IncuCyte Zoom System. Data are shown as mean (± SD) of triplicate measurements with NK cells from 1 donor and of cultures without NK cells.

