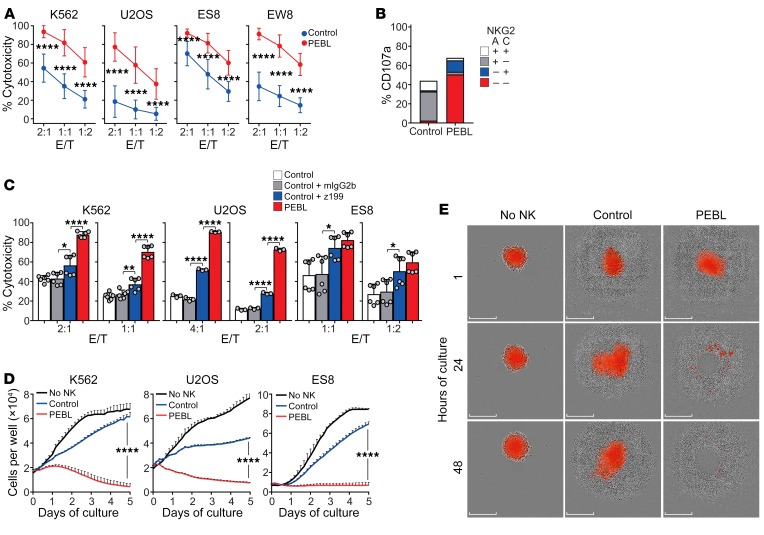
Figure 4. Downregulation of NKG2A increases NK cell cytotoxicity against tumor cells expressing HLA-E with HLA-G signal peptide (GpHLA-E).
(A) Four-hour cytotoxicity assays with NKG2A+ NK cells transduced with anti-NKG2A PEBL or GFP only (Control). Target cell lines were transduced with GpHLA-E (see Supplemental Figure 7) and luciferase. BrightGlo was added after 4 hours of coculture, and luminescence was measured using a Flx 800 plate reader. Data are shown as mean (± SD) of cell killing using target cells cultured without NK cells as reference. NK cells from 11 donors were tested with K562, 6 with U2OS, 8 with ES8, and 5 with EW8, all in triplicate. (B) Expression of CD107a among NK cell subsets after 4-hour coculture with K562-GpHLA-E cells. Percentages are shown as mean of triplicate measurements with NK cells from 1 donor. (C) Four-hour cytotoxicity (measured as in A) of GFP-transduced NK cells against GpHLA-E–transduced target cells in the presence of the anti-NKG2A antibody Z199 compared with that of anti-NKG2A PEBL-transduced NK cells. An isotype-matched (mIgG2b) nonreactive immunoglobulin served as a control. Data are shown as mean (± SD) of triplicate measurements with NK cells from 2 donors (K562, ES8) or 1 donor (U2OS). (D) Long-term cytotoxicity of PEBL-transduced and control NK cells against GpHLA-E+ target cells. Experiments were performed at E/T 1:8 for K562, 1:2 for U2OS, and 1:4 for ES8. Tumor cell growth was measured with IncuCyte Zoom System. Data are shown as mean (± SD) of triplicate measurements with NK cells from 1 representative donor (out of 3 tested) compared with growth of the cell line without NK cells. (E) Spheroid tumors formed with U2OS-GpHLA-E cells transduced with mCherry were cocultured with PEBL-transduced or control NK cells at a 2:1 E/T. Images were collected with the IncuCyte Zoom System. Scale bars: 300 μm. Numerical data are shown in Supplemental Figure 9. *P < 0.05; **P < 0.01; ****P < 0.0001, t test.

