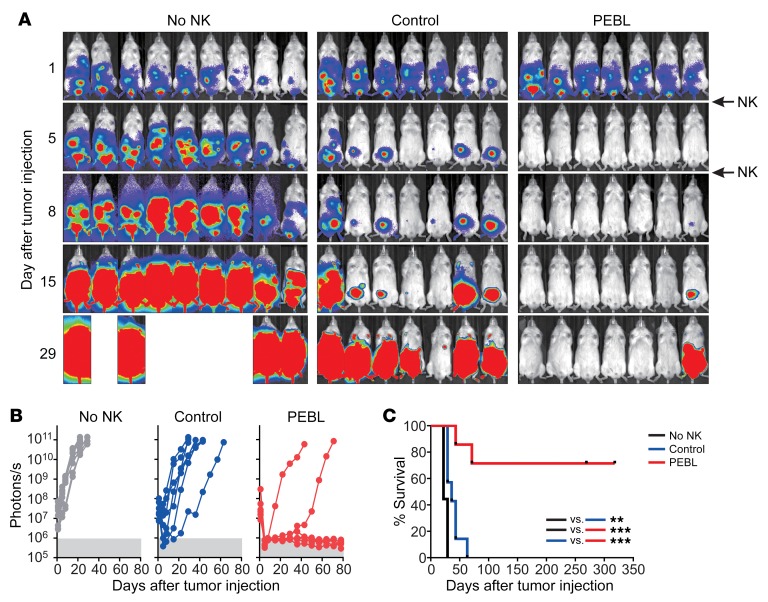
Figure 7. Antitumor capacity of anti-NKG2A PEBL-transduced NK cells in immunodeficient mice.
(A) ES8 cells (2 × 10⁵) transduced with GpHLA-E and luciferase were injected i.p. in 23 NOD/SCID IL2RGnull mice. One day later, mice were treated with 1 × 10⁷ expanded NKG2A+ NK cells transduced with either GFP alone (Control) or with anti-NKG2A PEBL (n = 7 for each group); another group of mice received tissue culture medium instead (no NK; n = 9). One additional injection of NK cells or medium was given 4 days later. All mice received i.p. injections of IL-2 (20,000 IU each) 3 times per week. Bioluminescence was measured with a Xenogen IVIS Spectrum System, with imaging beginning 5 minutes after i.p. injection of d-luciferin (150 μg/g body weight) and analyzed with Living Image 3.0 software. Collated ventral images of mice in 2 independent experiments are shown, 1 with 9 mice (3 in each group) and the other with 14 mice (6 injected with tumor alone, 4 treated with control NK cells, and 4 with anti-NKG2A PEBL NK cells). (B) Luminescence measurements of tumor cell growth. Each symbol corresponds to the sum of bioluminescence measurements by ventral and dorsal imaging in each mouse. (C) Kaplan-Meier curves and log-rank test for overall survival. Mice were euthanized when the sum of ventral and dorsal bioluminescence signal reached 5 × 10¹⁰ photons per second. **P = 0.0034; ***P < 0.001.

