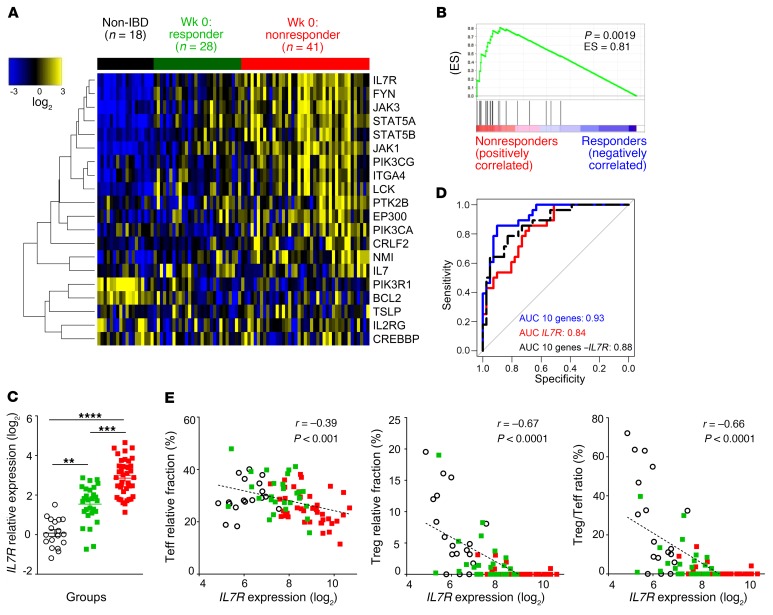
Figure 2. Colonic mucosal IL7R and IL-7R signaling pathway expression at baseline is associated with nonresponse to anti-TNF therapy.
(A) Heatmap of the expression of the 20 selected genes previously reported as key members of the IL-7R signaling pathway (40) in colon biopsies of non-IBD controls (n = 18), responders (green; n = 28), and nonresponders (red; n = 41) before anti-TNF therapy. Meta-analysis of 3 UC cohorts with histological healing as the anti-TNF response criterion: data sets GSE16879 (46), GSE12251 (45), and GSE73661 (47). The heatmap represents median centered colorized expression values in which yellow values indicate overexpression and blue values indicate underexpression. (B) Gene set enrichment analysis from the meta–data set at week 0 of the IL-7R signaling signature (20 selected genes). ES, enrichment score. (C) Relative IL7R expression before anti-TNF treatment (log2 data normalized to the control median) in the same groups of patients and colors as in A. (D) ROC analysis of expression of IL7R, the IL7R 10-gene signature (IL7R, IL2RG, JAK1, PIK3CA, LCK, PTK2B, EP300, NMI, CRLF2, and TSLP), and the signature without IL7R (9 genes) distinguishing anti-TNF responders and nonresponders. (E) Correlation of IL7R expression with enrichment of leukocyte subsets as estimated by CIBERSORT in the same groups of patients and colors as in A. Left: Effector T lymphocytes (Teff); middle: regulatory T lymphocytes (Treg); right: Treg/Teff ratio. **P < 0.01; ***P < 0.001; ****P < 0.0001 between indicated groups, Kruskal-Wallis test with post hoc Dunn’s multiple comparisons test.

