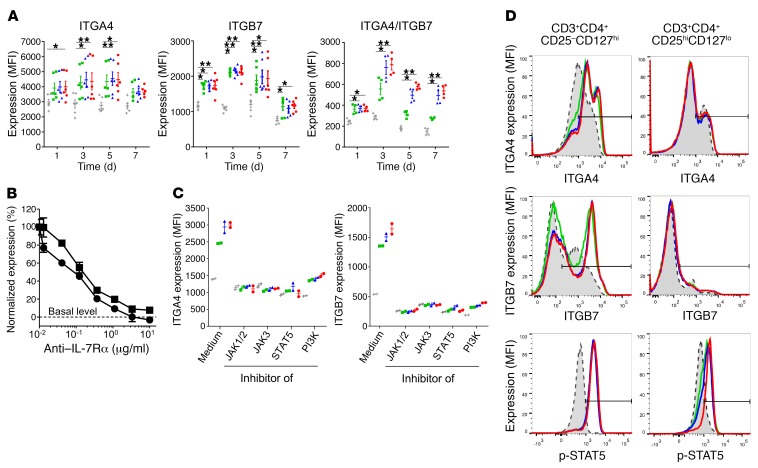
Figure 5. IL-7 controls α4β7 expression on human effector, but not regulatory, T lymphocytes.
(A) Surface expression of α4, β7, and α4β7 integrin heterodimers on human T lymphocytes from the blood of healthy volunteers cultured for the indicated periods of time in medium alone (white bars) or supplemented with recombinant human IL-7 at 1 ng/ml (green), 5 ng/ml (blue), or 25 ng/ml (red). Data are expressed as median fluorescent intensity ± SEM measured by flow cytometry (n = 6). (B) Human T cells were cultured for 3 days with 5 ng/ml of recombinant human IL-7 and a blocking anti–human IL-7Rα mAb at different concentrations. ITGA4 (squares) and ITGB7 (circles) overexpression was normalized to the condition without anti–IL-7Rα mAb and expressed as mean ± SEM. Dotted line represents basal level expression at t0. (C) Surface expression of α4 and β7 integrin on human T lymphocytes cultured for 48 hours in medium alone (gray) or supplemented with recombinant human IL-7 at 1 ng/ml (green), 5 ng/ml (blue), or 25 ng/ml (red) and, when indicated, with 10 μg/ml JAK1/2 inhibitor (ruxolitinib), 5 μM JAK3 inhibitor (CAS 202475-60-3), 5 μM STAT5 inhibitor (CAS 285986-31-4), or 12.5 μM PI3K inhibitor (LY294002). Data are expressed as median fluorescent intensity ± SEM measured by flow cytometry. (D) Human effector (CD25–CD127hi) and regulatory (CD25hiCD127lo) CD4+ T cells, purified by flow cytometry using a nonantagonistic anti–human CD127 (IL-7Rα) mAb, were cultured with medium alone (gray histogram) or supplemented with 1 ng/ml (green), 5 ng/ml (blue), or 25 ng/ml (red) of human IL-7. IL-7 signaling (STAT5 phosphorylation) was measured after 15 minutes of culture, while ITGA4 and ITGB7 expression was evaluated at 48 hours. Data show 1 representative of 5 experiments. *P < 0.05; **P < 0.01 between indicated groups, Kruskal-Wallis test with post hoc Dunn’s multiple comparisons test.

