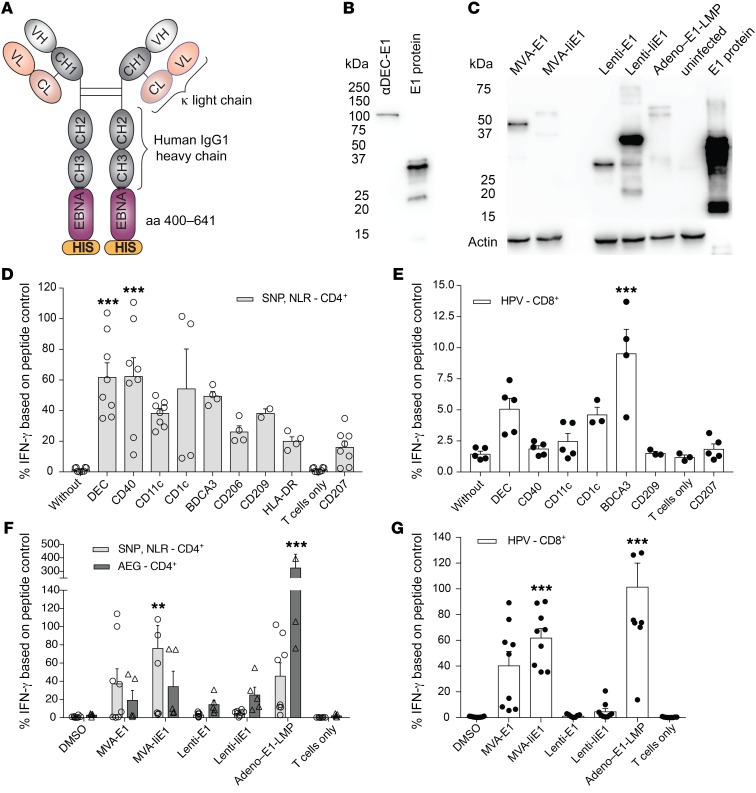
Figure 1. Human CD4+ and CD8+ T cell recognition of EBNA1 carrying or encoding vaccine formulations.
(A) Structure of humanized EBNA1-Ab fusion proteins. (B) Western blot analysis of human αDEC205-EBNA1 Ab under reducing conditions using rat αEBNA1 Ab (clone 1H4). Lane 1 represents heavy-chain EBNA1 (100 kDa) and lane 2 recombinant truncated EBNA1. (C) Western blot analysis of viral vectors encoding truncated EBNA1, using rat αEBNA1 Ab (clone 1H4) 48 hours after infection of HEK293T cells. MVA-E1 carries EBNA1 without the Gly/Ala repeat and runs at approximately 45 kDa (25); MVA-IiE1 has the additional invariant chain domain. Lenti-E1 carries only EBNA1 from aa 400–641 with an approximate size of 30 kDa. Infection with Adeno–E1-LMP also leads to expression of the Gly/Ala repeat–deleted EBNA1 protein, however with additional LMP polyepitopes (26), and migrates at approximately 60 kDa. Lane 6 represents uninfected HEK293T cells and lane 7 recombinant truncated EBNA1. (D and E) Autologous PBMCs were incubated with medium for 4 hours with 1 μg/ml EBNA1 fused to an Ab against the indicated receptors, or for 1 hour with the cognate peptides for the respective T cell clones. Coculture with (D) EBNA1-specific CD4+ T cell clones, with cognate epitope NLR and SNP shown in the gray bars, and (E) EBNA1-specific CD8+ T cell clones, with cognate epitope HPV shown in the white bars. T cell activity was measured by IFN-γ release into the supernatant. IFN-γ signal is shown as a percentage of the peptide control. Data are shown as the mean ± SD of at least 2 independent experiments. ***P < 0.005 versus unspecific CD207-targeting; 1-way ANOVA with Bonferroni’s pre-test . (F and G) Autologous PBMCs were infected with DMSO control, MVA-EBNA1, MVA-liEBNA1, or Adeno–EBNA1-LMP at a MOI of 10 for 48 hours and with Lenti-EBNA1 or Lenti-IiEBNA1 for 96 hours. Coculture with (F) EBNA1-specific CD4+ T cell clones, with cognate epitope NLR and SNP shown in the light gray bars and cognate epitope AEG shown in the dark gray bars, and (G) EBNA1-specific CD8+ T cell clones, with cognate epitope HPV shown in the white bars. T cell activity was determined as in D and E. Data are shown as the mean ± SD of 2 independent experiments. **P < 0.01 and ***P < 0.005; 1-way ANOVA plus Bonferroni’s pre-test.

