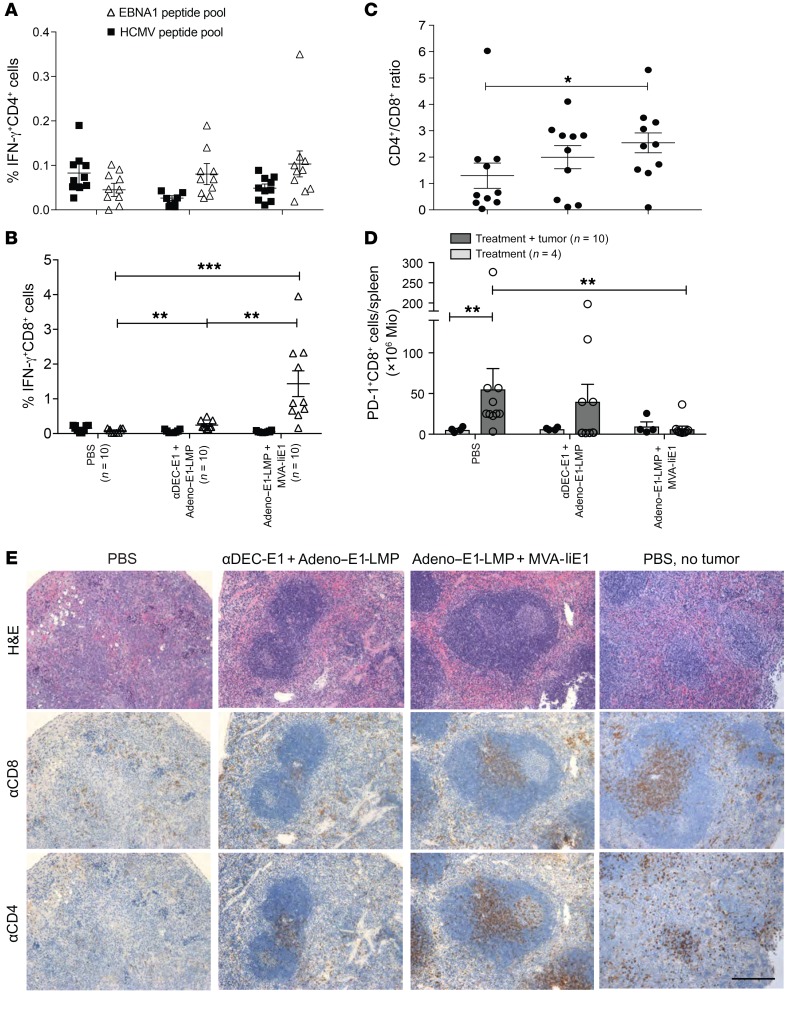
Figure 7. Characteristics of T cell responses toward EBNA1-induced B cell lymphomas with and without protective vaccination.
huDEC205-Tg mice were immunized with different combinations of vaccines for the prime and the boost, scheduled 10 days apart. Mice in the preventive group were challenged i.v. with 3 × 10⁶ to 5 × 10⁶ BL-E1 tumor cells 14 days after the boost. (A) At sacrifice, bulk splenocytes were harvested and stimulated with 1 μg/ml EBNA1 or control HCMV pp65 peptide pools. IFN-γ production was monitored by ICS in CD4+ gated cells. Data are shown as the mean ± SEM from 2 independent experiments with at least 5 mice per group. Statistical analyses was done using a 2-tailed Mann-Whitney U test. (B) After splenocyte stimulation, IFN-γ production was monitored by ICS in CD8+ gated cells. Data are shown as the mean ± SEM from 2 independent experiments with at least 5 mice per group. **P < 0.01 and ***P < 0.001; Kruskal-Wallis with Dunn’s multiple comparisons test (C) The CD4+/CD8+ T cell ratio was calculated using the percentages of each subset in the spleen. *P < 0.05; 1-way ANOVA with Tukey’s multiple comparisons test. (D) At sacrifice, bulk splenocytes were harvested and stained for PD-1 on CD8+ gated cells. Total PD-1+CD8+ cell amounts per spleen were calculated using the total splenocytes count. Data are shown as the mean ± SEM from 2 independent experiments with at least 5 mice per group. Mice with PBS treatment or vaccination and tumor injection were compared with mice that were only treated with PBS or vaccinated. **P < 0.01; Kruskal-Wallis with Dunn’s multiple comparisons test. (E) Splenic tissue was fixed in PFA and embedded in paraffin and then stained with H&E, αCD8, and αCD4. One representative image from each group is shown, along with an image of splenic cells from a PBS-treated mouse without tumor challenge. Scale bar: 20 μm.

