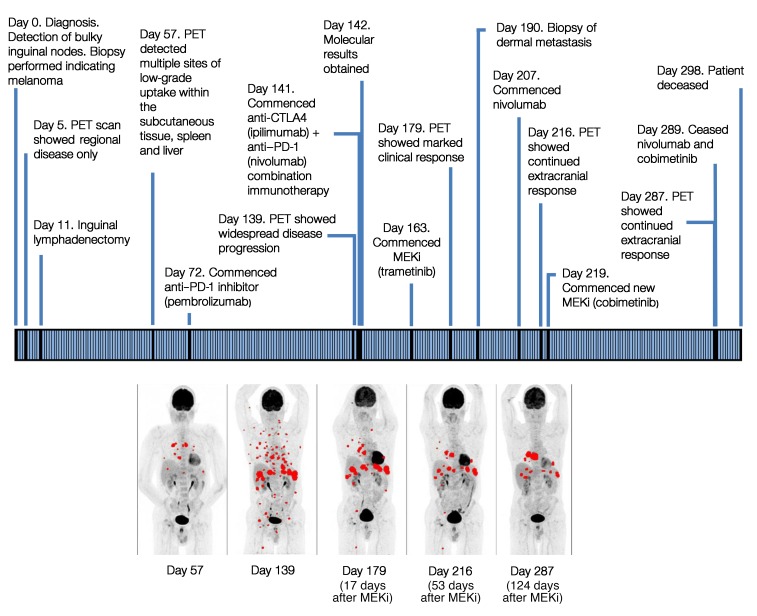
Figure 2. Clinical timeline for the patient, with maximum-intensity projection FDG-PET imaging times noted.
Maximum-intensity projection (MIP) FDG-PET (MIP PET) images show a profound clinical response after MEKi treatment. Day 57: image shows baseline metastatic disease before MEKi treatment. Day 139: disease progression seen on follow-up study. Day 179 (17 days after MEKi): significant metabolic response. Day 216 (53 days after MEKi) and day 287 (124 days after MEKi): continued metabolic response. The maximum standardized uptake value (SUVmax) of a representative target lesion declined from 9.0 on day 139 (before MEKi) to 6.0 on day 179, to 4.2 on day 216, and to 1.8 on day 287. All FDG-avid metastatic sites are shown in red.

