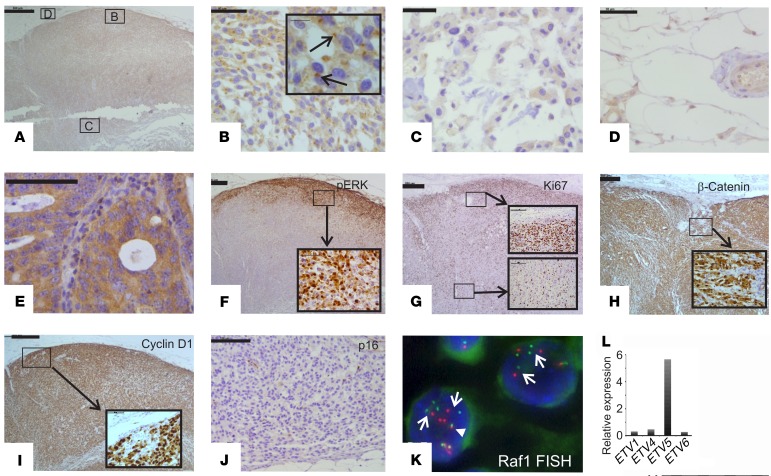
Figure 3. Expression of key MAPK, WNT, and cell-cycle proteins.
(A–E) IHC for CRAF in (A–D) a lymph node metastasis and in (E) an on-slide positive control (colorectal adenocarcinoma). The locations of the images in B–D (boxes) are shown in A. Arrows in the enlarged inset image in B point to strong paranuclear staining in peripheral tumor cells in the lymph node metastasis. Weak cytoplasmic staining is evident in the central tumor cells in the lymph node metastasis (C) and in the perinodal stromal cells (D), and strong diffuse cytoplasmic staining is seen, without paranuclear accentuation, in the colorectal adenocarcinoma (E). (F) IHC for p-ERK shows strong nuclear staining and weak cytoplasmic staining in peripheral tumor cells in the lymph node metastasis (enlarged inset image). (G) IHC for Ki67 shows a high percentage of labeled tumor cells in the periphery but not the center of the lymph node metastasis. Note the expression pattern, which is similar to that of p-ERK. (H and I) IHC for β-catenin (H) and cyclin D1 (I) shows strong nuclear and moderate cytoplasmic staining in both peripheral and central tumor cells (enlarged inset images). (J) IHC for p16 shows no staining in tumor cells (the occasional positive staining is seen in stromal cells). (K) Break-apart RAF1 FISH in tumor cells in the lymph node metastasis. Note the multiple widely separated 5′ (green, centromeric) and 3′ (red, telomeric) signals in tumor cells (arrows). A fused 5′ and 3′ signal is shown for comparison (arrowhead). (L) Archer Dx RNA analysis of relative expression of ETS family members shows elevated expression of the RAS/RAF downstream coeffector ETV5. Scale bars: 500 μm (A and F–I), 100 μm (E and J), and 50 μm (B–D); enlarged insets: 10 μm (B), 100 μm (G), 50 μm (F, H, and I).

