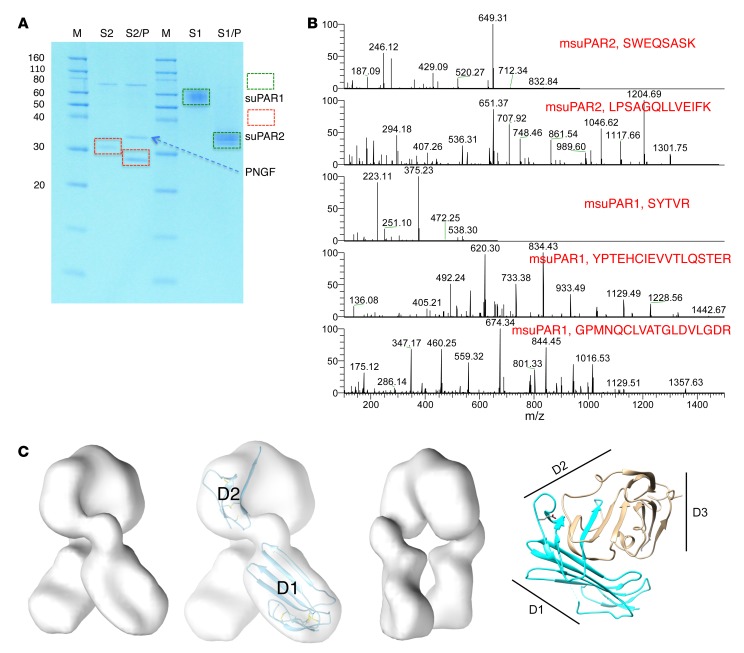
Figure 1. Characterization of msuPAR recombinant proteins.
(A) SDS gel analysis of purified msuPAR1 and msuPAR2 before (S2 and S1) and after (S2/P and S1/P) deglycosylation with PNGase F. S1, msuPAR1; S2, msuPAR2; P, PNGase F. (B) LC-MS verification of recombinant msuPAR1 and msuPAR2 proteins. Shown are representative mass spectra of identified peptides from the deglycosylated msuPAR proteins. (C) EM structure modeling of msuPAR2. The isosurface has been set to enclose 100% of the expected protein mass. The image that is second from the left shows the same map as the first, but displays the fit of domains D1 and the expressed portion of domain D2 in the map. The additional sequences following the splice junction have not been modeled. The third image shows the same map as the first, but rotated 90°. The fourth image shows the ribbon diagram of the msuPAR1 structure (pdb id 3LAQ) for comparison. The region included in msuPAR2 is indicated in blue. Locations of the 3 domains of msuPAR1 are indicated with black lines.

