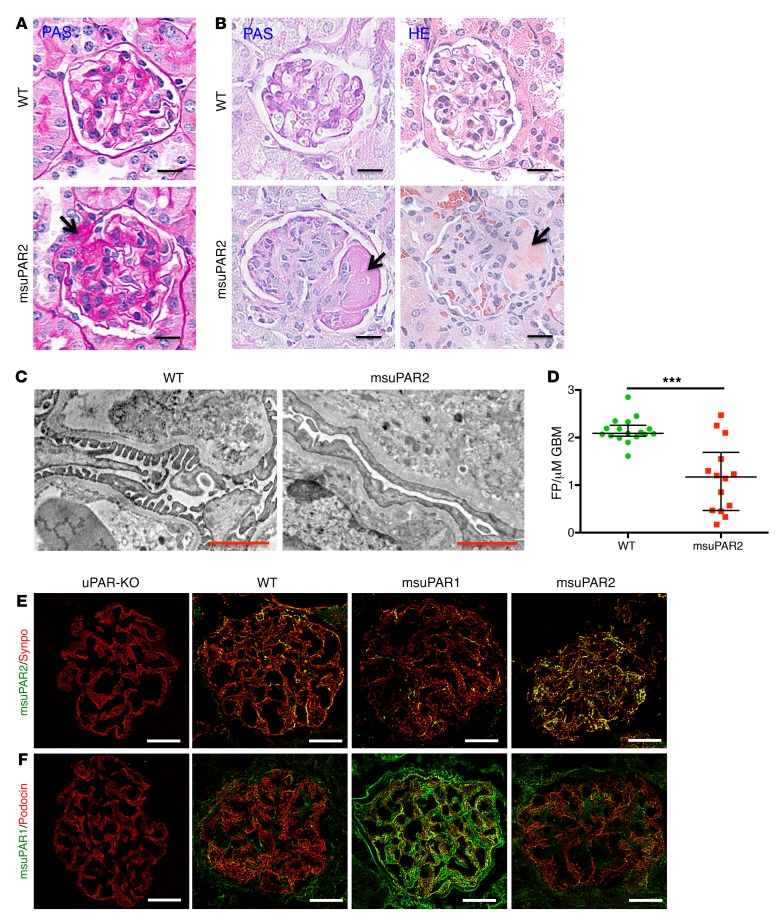
Figure 4. msuPAR2-Tg mice present FSGS-like kidney pathology.
(A) PAS staining of kidney sections from spontaneous non–HFD treated mice. Segmental glomerular sclerosis was shown in some glomeruli of msuPAR2-Tg mice. In contrast, no abnormality was observed in littermate control WT mice. Scale bars: 20 μm. Arrow shows sclerotic area. (B) Kidney histology of HFD-treated mice. Left panel, PAS staining; right panels, H&E staining. Histological features of advanced FSGS were observed in HFD-treated msuPAR2-Tg mouse kidneys. Scale bars: 20 μm. Arrows show sclerotic area. TEM examination (C) and analysis (D) indicate that foot-process (FP) effacement significantly increased with msuPAR2-Tg mice. Data were represented by the FP counts per μm of glomerular basement membrane (GBM). n = 17 WT; n = 14 msuPAR2-Tg. ***P < 0.001, Student’s t test. Scale bars: 1 μm. (E) Localization of msuPAR2 in the glomeruli. Kidney cryosections were performed with double-immunofluorescent stainings with anti-msuPAR2 antibody and anti-synaptopodin antibody. Syno, synaptopodin (used as a podocyte marker). Colocalization of msuPAR2 (green) with synapopodin (red) is shown in brown. (F) Localization of msuPAR1 in the glomeruli by msuPAR1 antibody. Compared with WT and msuPAR2-Tg mice, an abundance of msuPAR1 was clearly observed in the msuPAR1-Tg mice. Scale bars: 20 μm. Negative staining of both msuPAR1 and msuPAR2 in uPAR-KO mice indicates the specificities of the suPAR antibodies employed.

