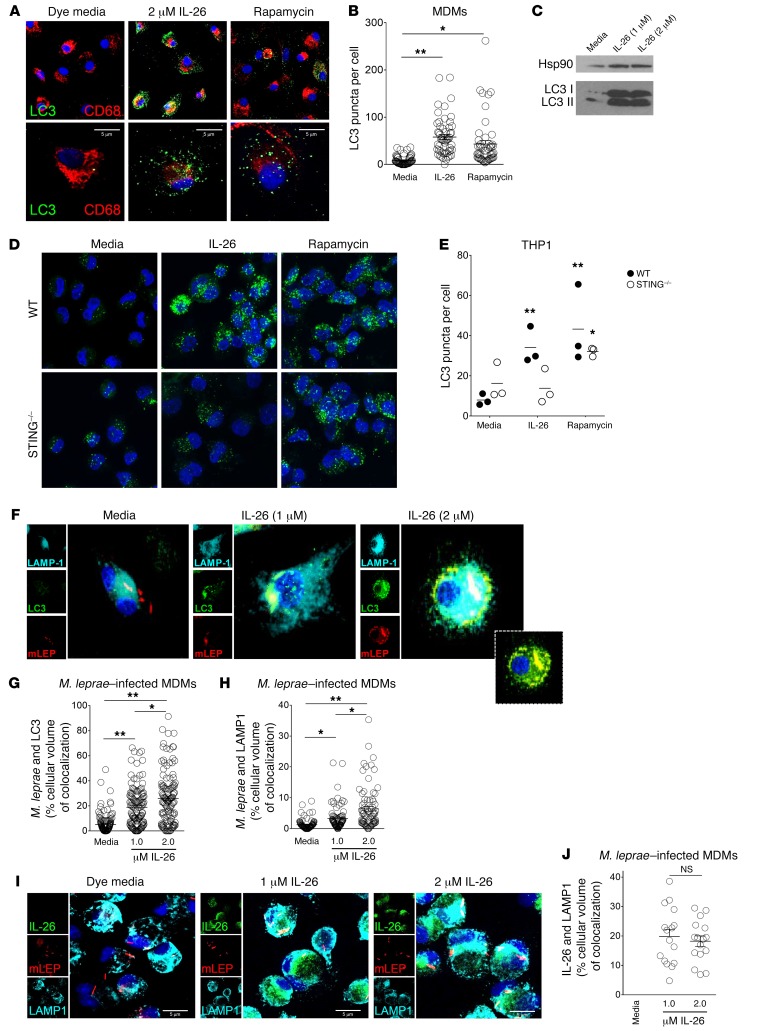
Figure 7. IL-26 induces autophagy and enhances bacterial trafficking to the lysosomes.
(A) MDMs were cultured with IL-26 or media overnight and then immunolabeled with anti-LC3 Ab (green) and anti-CD68 Ab (red). Nuclei were stained with DAPI (blue). Original magnification, ×63. Scale bars: 5 μm. (B) LC3 puncta per cell ± SEM (n ≥ 50 cells from 4 donors). (C) LC3 I to LC3 II conversion was detected by immunoblotting. Hsp90 was used as an internal control. (D) PMA-treated THP-1 cells were treated with IL-26 (2 μM) for 24 hours and with rapamycin (300 nM) for 6 hours and then immunolabeled with LC3 Ab (green). Nuclei were stained with DAPI (blue). Data shown are representative of 1 of 3 independent experiments for both WT and STING–/– THP-1 cells. Original magnification, ×63. (E) LC3 puncta per cell ± SEM (n ≥ 50 cells from 3 donors for both WT and STING–/– THP-1 cells). (F) Human MDMs were treated with IL-26 for 30 minutes and infected with M. leprae (red) overnight. Cells were washed, fixed, and immunolabeled with anti-LC3 (green) and LAMP-1 (cyan). Nuclei were stained with DAPI (blue). Data shown are representative of 4 individual donors. Inset image is of LC3 (green) and M. leprae (red) overlay, without LAMP1 (cyan). Original magnification, ×63 and x630 (enlarged insets). (G) Colocalization of LC3 and M. leprae and (H) colocalization of LAMP1 and M. leprae were quantified with ImageJ. Data represent the mean percentage of the cellular volume of colocalization ± SEM (n ≥ 30 cells from 4 donors). (I) Human MDMs were treated with Alexa 488–IL-26 (green) for 30 minutes and infected with M. leprae (red) overnight. Cells were washed and immunolabeled with anti-LAMP1 (cyan). Nuclei were stained with DAPI (blue). Media contained Alexa Fluor 488 dye as a control. Data shown are from 4 individual donors. Scale bars: 5 μm. (J) Colocalization of IL-26 and LAMP1 was quantified with ImageJ. Data are represented as the mean percentage of the cellular volume of colocalization ± SEM (n ≥ 40 cells from 4 donors). *P < 0.05 and **P < 0.01, by repeated-measures 1-way ANOVA.

