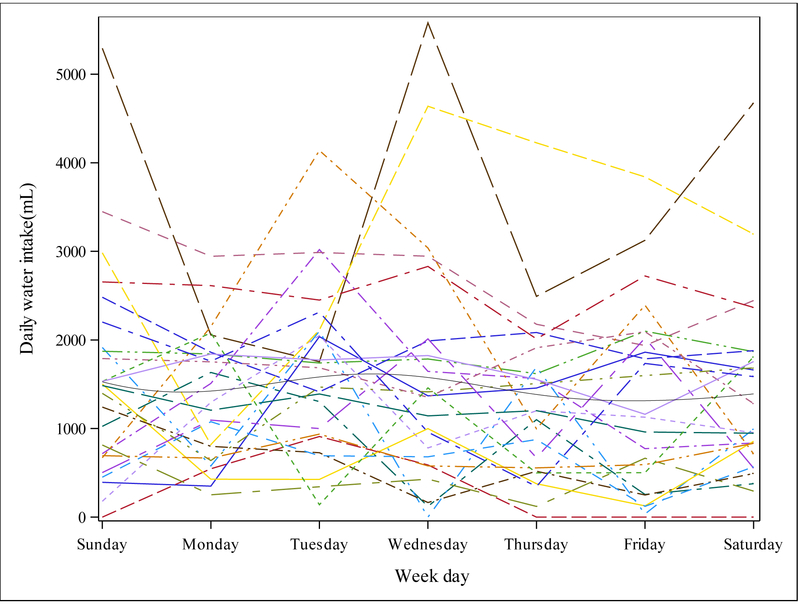
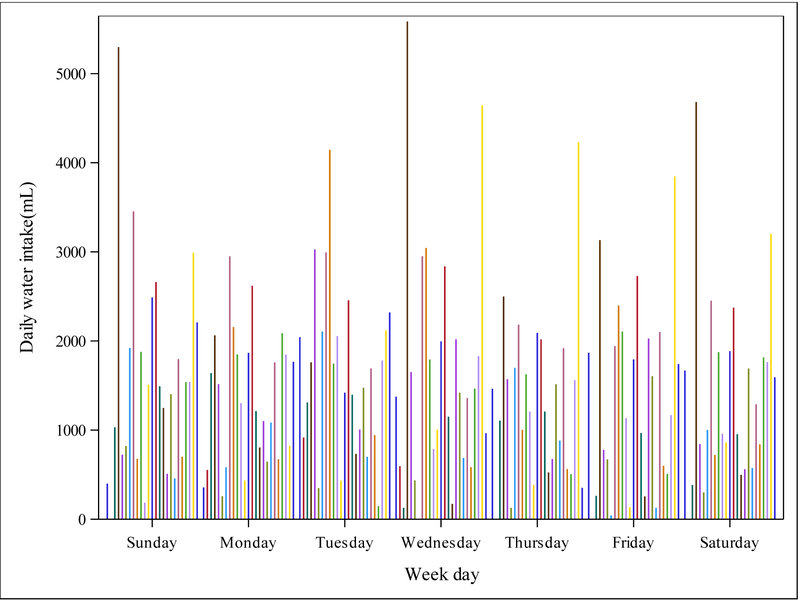
Figure 1. Mean daily water intake for each day of the 7-day study period, by participant.
Each light grey line represents an individual participant. The dark grey line is the mean daily water intake for the 25 participants. Mean daily water intake for the entire cohort was similar across the study period with no observable differences between weekday and weekend days.


