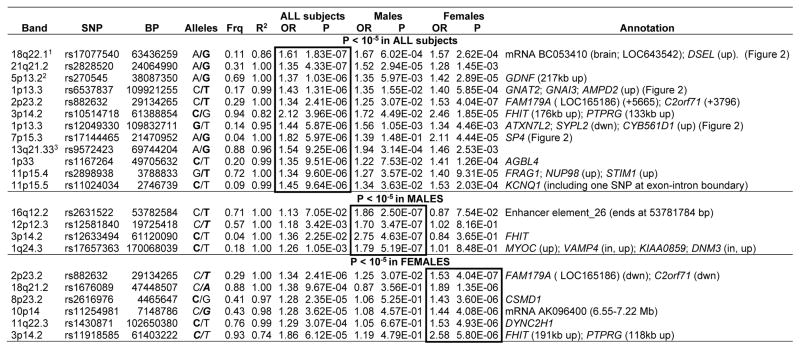
Table 2.
Strongest association findings (All, Male or Female subjects)
The SNP with the lowest P-value is listed for all genes or nongenic regions with at least one SNP with P < 10−5, separately for the analyses of all subjects (primary analysis), males, and females. The Annotation column lists all genes in the region with one or more SNPs with P < 10−5, either within the gene or within 50 kb upstream (up) or downstream (dwn), unless a longer distance is listed. Other functional elements in a region are as noted. Nongenic regions all contain peaks of bioinformatically predicted high homology to known regulatory sequences.35
OR=Odds Ratio for the tested allele, indicated in bold font in the Alleles column.
Frq=frequency of the tested allele in Controls. (Case-control frequencies for All Subjects findings are available in online Table S11.)
R2 indicates the R2 predicted (by MACH 1.0) between imputed and actual genotypes; R2 = 1 indicates that the SNP was genotyped.
Note that many of these regions contained multiple SNPs with low P-values, see online file genred_supplementary_data.txt.
P=6.04 × 10⁻⁷ in the meta-analysis of Narrow cases (GenRED, STAR*D and GAIN) in a companion paper.17 2- P=1.88 × 10⁻⁶ in the Narrow meta-analysis.

