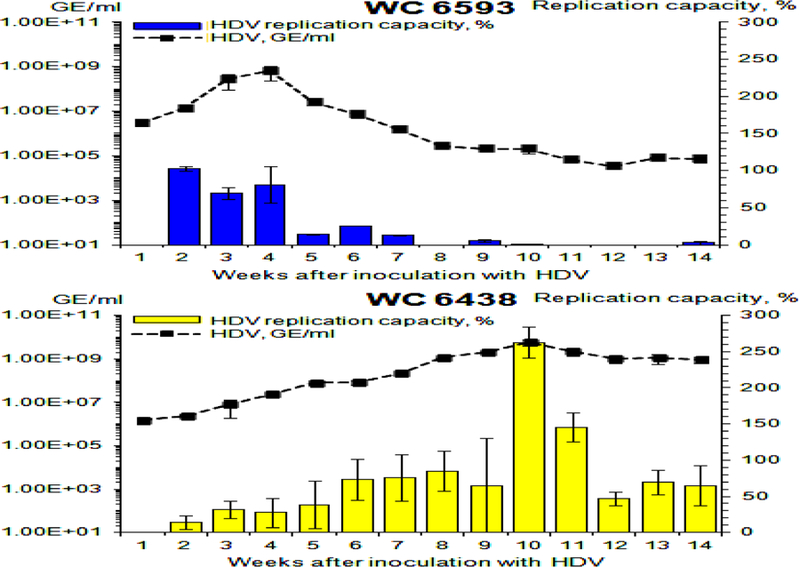
Fig. 5. Replication capacity of virion-associated HDV RNA genomes harvested from woodchucks M6593 and F6438.

The replication capacity of HDV genomes was analyzed using transfection of HDV RNA isolated from serum virions into Ag-293 cells. The details are described in Materials and Methods. The left Y axis reflects serum concentration of HDV (black rectangles) in logarithmic scale. The right Y axis represents the values of replication capacity, which is a normalized parameter that shows how many new HDV genomes/cell were produced as a result of transfection per each HDV genome used per cell in the transfection mixture. In vitro transcribed and gel-purified unit length HDV RNA (58) was used a positive control. The level of the replication capacity measured for this control RNA was considered as 100% value. The values of the replication capacity (%) are shown as blue (M6593) or yellow (F6438) bars. The X axis represents the time (week) after super-infection with HDV. The top panel shows the results for woodchuck M6593, while the bottom panel - for woodchuck F6438.
