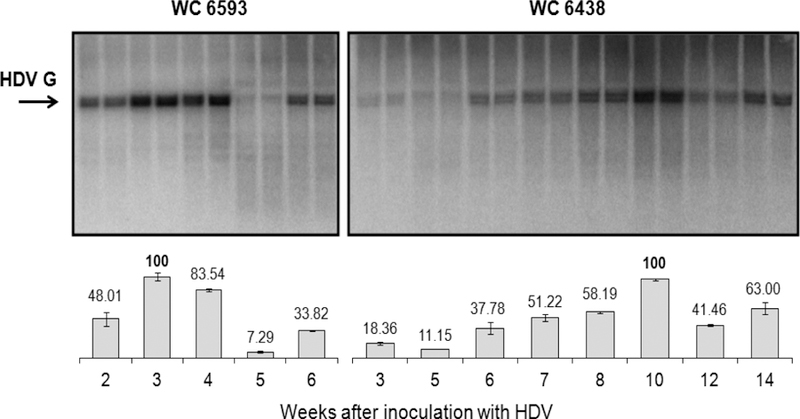
Fig. 8. Northern analysis of serum HDV RNA genomes harvested from woodchucks M6593 and F6438.

The HDV G RNA isolated from serum virions was quantified by qPCR and 106 HDV GE were loaded onto each lane of the Northern gel. The details are described in Materials and Methods. The top panel shows the gel images for samples from woodchuck 6593 (left) and woodchuck 6438 (right). The position of the full genome size unit length (i.e., full-length) HDV G RNA is shown by the arrow. The bottom panel shows the calculations of the fractions of the full-length HDV G RNA in each sample. The value of 100% was assigned to the highest number of full-length HDV G RNA observed for each animal. At the bottom of the Figure, the time after the HDV super-infection (week) is indicated. Each time point is represented in the Northern gels by two adjacent lanes. The abovementioned calculations represent the average number obtained for such two lanes (i.e., duplicate samples).
