
Fig. 5: OPC perivascular clusters trigger a CNS inflammation.
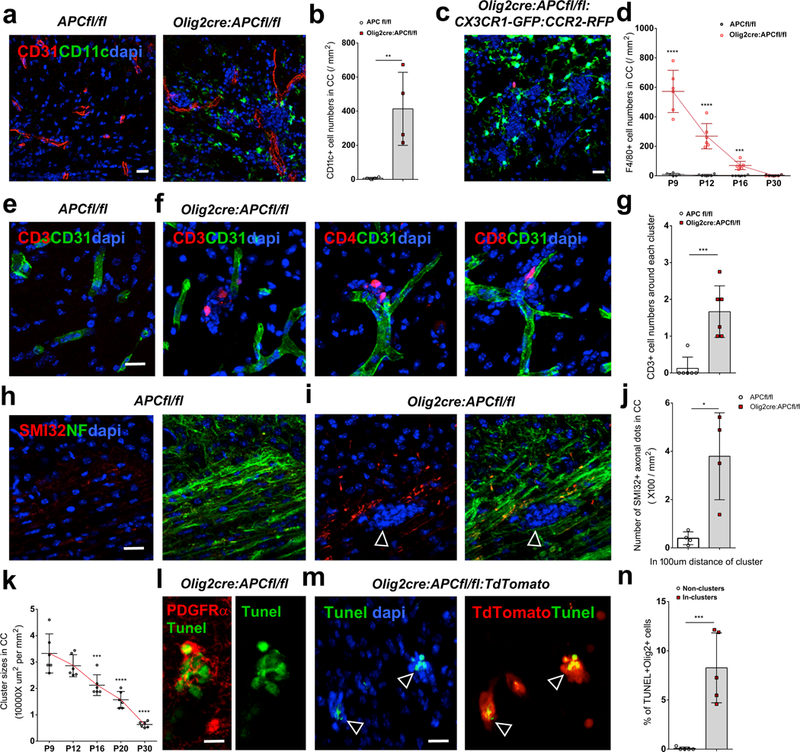
(a-b) Marked upregulation of CD11c expression in P9 Olig2-cre:APC fl/fl brain compared to controls around OPC perivascular clusters (stained with dapi), quantified in (b)(n=4 animals; p=0.009). Data were analyzed by unpaired two-sided Student’s t test. (c) As Cd11c can detect some other immune cells in addition to activated microglia and macrophages, we made use of CX3CR1-GFP: CCR2-RFP mice (which label microglia green, and macrophages red) crossed into Olig2cre:APC fl/fl, identifying these cells as predominantly activated microglia around OPC clusters. (d) Frequency of F4/80 expressing cells at different postnatal times in CC in Olig2-cre:APC fl/fl versus controls (n=6 animals at each time, all statistical analyses compare Olig2cre:APC fl/fl to controls at each time, P9 p=2.28 E-6, P12 p=1.94 E-5, P16 p=1.39 E-4, P30 p=0.5490). Data were analyzed by unpaired two-sided Student’s t test. (e-f) Extravasation of small numbers of CD3+, CD4+ and CD8+ T cells within OPC perivascular clusters in P9 Olig2 cre: APC fl/fl mouse brain (f) which are not seen in APCfl/fl controls (e). (g) Quantification of CD3+ cell numbers per perivascular cluster in Olig2-cre:APC fl/fl versus controls (n=6 animals, p=0.0006). Data were analyzed by unpaired two-sided Student’s t test. (h-i) SMI-32+ (non phosphorylated neurofilament) axonal spheroids co-localize with the neurofilament marker NF200 (NF), indicating swellings of damaged axons adjacent to an OPC perivascular cluster (arrows in i, stained with dapi) in Olig2cre:APC fl/fl P9 brain, which are not seen in controls (h). (j) Quantification of SMI32+/NF200+ axonal dots within 100μm distance of clusters in Olig2cre:APCfl/fl P9 CC versus similar areas in APCfl/fl (n=4 animals, p=0.0286). Data were analyzed by unpaired two-sided Student’s t test. (k) Quantification of OPC perivascular cluster size in Olig2 cre: APC fl/fl: TdTomato corpus callosum at times between P9 and P30 (n=6 animals, all statistical analyses compared to P9, P12 vs. P9 p=0.3846, P16 vs. P9 p=0.0007, P20 vs. P9 p=3.37 E-6, P30 vs. P9 p=2.55 E-8). Data were analyzed by unpaired two-sided Student’s t test. (l-m) Tunel staining in P9 mouse brain co-localizes with (l) PDGFRα (in Olig2cre:APC fl/fl) and with (m) TdTomato (in Olig2cre:APC fl/fl: TdTomato, arrows) indicating OPC death within perivascular clusters. (n) Percentage of TdTomato+ cells that are TUNEL+ in perivascular clusters versus non clusters in Olig2cre:APCfl/fl:TdTomato (n=6 animals, p=0.0009). Data were analyzed by unpaired two-sided Student’s t test.Scale bars, 10μm (l), 20μm (all other panels). * P < 0.05, ** P < 0.01, *** P < 0.001, **** P < 0.0001. Values are mean ± s.d.