
Fig. 6: Wif1 production by Wnt activated perivascular OPCs disrupts EC tight junctions.
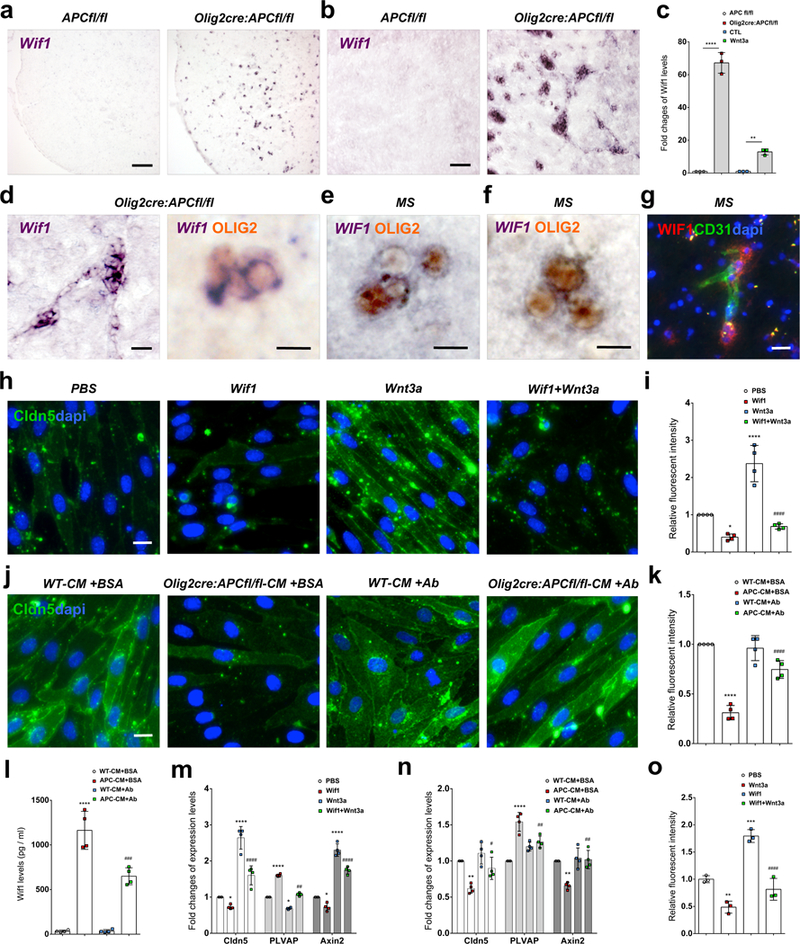
(a-c) Wif1 mRNA is highly upregulated by Wnt activation in OPCs in Olig2cre:APCfl/fl mice in vivo in P9 mouse (a) spinal cord and (b) corpus callosum and (c) in vitro (fold change by qPCR) in isolated OPCs from Olig2cre:APCfl/fl compared to APCfl/fl (n=3 independent experiments, ****p=5.43E-5), and in isolated WT OPCs treated with Wnt3a compared to untreated CTL (n=3 independent experiments, **p=0.0093). Data were analyzed by unpaired two-sided Student’s t test (c). (d) Significantly upregulated Wif1 mRNA in vivo co-localizes with Olig2 protein in clustered cells in Olig2cre:APCfl/fl corpus callosum. (e-f) WIF1 is expressed by clustered OLIG2+ cells in MS active lesion white matter (f). (g) WIF1 protein expression by cells around CD31+ vasculature (arrows) in MS lesion white matter. (h) Tight junctions stained for Claudin5 (Cldn5) protein in isolated CNS endothelial cells (ECs) treated with control PBS, Wif1, Wnt3a, or Wif1+Wnt3a for 2 days, and (i) Claudin5 fluorescent intensity sums (as fold change compared to PBS control) in EC cultures under these treatment conditions (n=4 independent experiments; PBS vs. Wif1 *p=0.0235; PBS vs. Wnt3a ****p=2.59 E-5; Wnt3a vs. Wif1+Wnt3a ####p=3.03 E-6). Data were analyzed by one-way ANOVA. (j) Claudin5+ tight junctions in isolated ECs treated for 2 days with conditioned medium from APCfl/fl or Olig2cre:APC fl/fl OPCs (WT-CM+BSA and Olig2cre:APC fl/fl-CM+BSA respectively) or conditioned medium from the same OPCs depleted of Wif1 protein by overnight anti-Wif1 antibody (+Ab) treatment and agarose bead pull down, and (k) Claudin5 fluorescent intensity sums (as fold change compared to WT-CM+BSA control) in EC cultures under these treatment conditions (n=4 independent experiments; WT-CM+BSA vs. APC-CM+BSA ****p=3.13 E-7; APC-CM+BSA vs. APC-CM+Ab ####p=5.49 E-5). Data were analyzed by one-way ANOVA. (l) ELISA OD values for Wif1 protein concentrations in conditioned medium from these groups (n=4 independent experiments; WT-CM+BSA vs. APC-CM+BSA ****p=6.79 E-8; WT-CM+AB vs. APC-CM+Ab ###p=0.0002). Data were analyzed by one-way ANOVA. (m-n) Fold change of mRNA in cultured ECs (by qPCR relative to control) for tight junction marker Claudin5, endothelial fenestrae marker PLVAP, and Wnt pathway activation marker Axin2 in the Wif1/Wnt3a treatment groups from Fig.4h (m), and the OPC conditioned medium treatment groups from Fig. 4j (n). (m) n=4 independent experiments; Claudin5: PBS vs. Wif1 *p=0.0381; PBS vs. Wnt3a ****p=3.86 E-7; Wnt3a vs. Wif1+Wnt3a ####p=6.16 E-5; PLVAP: PBS vs. Wif1 ****p=1.46 E-11; PBS vs. Wnt3a *p=0.0137; Wnt3a vs. Wif1+Wnt3a ##p=0.0017; Axin2: PBS vs. Wif1 *p=0.0338; PBS vs. Wnt3a ****p=8.97 E-9; Wnt3a vs. Wif1+Wnt3a ####p=8.07 E-5. Data were analyzed by one-way ANOVA. (n) n=4 independent experiments; Claudin5: WT-CM+BSA vs. APC-CM+BSA **p=0.0019; APC-CM+BSA vs. APC-CM+Ab #p=0.018; PLVAP: WT-CM+BSA vs. APC-CM+BSA ****p=3.93 E-6; APC-CM+BSA vs. APC-CM+Ab ##p=0.00217; Axin2: WT-CM+BSA vs. APC-CM+BSA **p=0.00164; APC-CM+BSA vs. APC-CM+Ab ##p=0.00103; In these three biomarkers, WT-CM+BSA vs. WT-CM+Ab has no significant difference. Data were analyzed by one-way ANOVA. (o) In vitro BBB endothelial permeability assay with control PBS, Wif1, Wnt3a, or Wif1+Wnt3a (n=3 independent experiments; PBS vs. Wnt3a **p=0.0063; PBS vs. Wif1 ***p=0.0004; Wif1 vs. Wif1+Wnt3a ####p=8.22 E-5). Data were analyzed by one-way ANOVA. Scale bars, 90μm (a, b), 20μm (d left panel, g), 10μm (d right panel, e, f, h, j). Values are mean ± s.d.